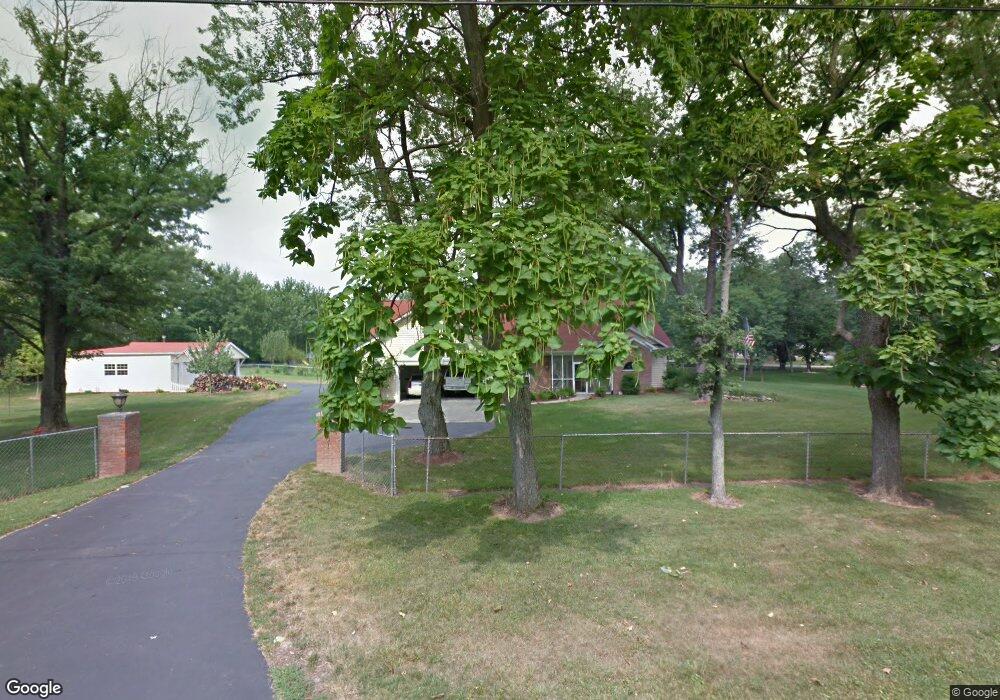
4281 N Hyland Ave Dayton, OH 45424
Forest Ridge Quail Hollow NeighborhoodEstimated Value: $399,000 - $491,000
3
Beds
2
Baths
2,388
Sq Ft
$187/Sq Ft
Est. Value
About This Home
This home is located at 4281 N Hyland Ave, Dayton, OH 45424 and is currently estimated at $446,159, approximately $186 per square foot. 4281 N Hyland Ave is a home located in Montgomery County with nearby schools including Fairborn Primary School, Fairborn Intermediate School, and Fairborn Middle School.
Ownership History
Date
Name
Owned For
Owner Type
Purchase Details
Closed on
Jun 10, 2021
Sold by
Ramirez Eliazar
Bought by
Whitehead Wesley A and Whitehead Abby E
Current Estimated Value
Home Financials for this Owner
Home Financials are based on the most recent Mortgage that was taken out on this home.
Original Mortgage
$349,200
Interest Rate
3%
Mortgage Type
New Conventional
Purchase Details
Closed on
Jun 11, 2012
Sold by
Oyer Marianne H and Oyer Irvin W
Bought by
Ramirez Eliazar and Ramirez Mary
Purchase Details
Closed on
Nov 29, 2004
Sold by
Litteral David
Bought by
Oyer Marianne H and Oyer Irvin W
Purchase Details
Closed on
Jan 3, 2001
Sold by
Eric Litteral David and Eric Theresa L
Bought by
Litteral Theresa Lynn
Purchase Details
Closed on
Jul 18, 1997
Sold by
Litteral Theresa L
Bought by
Litteral David Eric
Create a Home Valuation Report for This Property
The Home Valuation Report is an in-depth analysis detailing your home's value as well as a comparison with similar homes in the area
Home Values in the Area
Average Home Value in this Area
Purchase History
| Date | Buyer | Sale Price | Title Company |
|---|---|---|---|
| Whitehead Wesley A | $363,500 | Land Title | |
| Ramirez Eliazar | $255,000 | Home Services Title Llc | |
| Oyer Marianne H | $80,000 | None Available | |
| Litteral Theresa Lynn | -- | -- | |
| Litteral David Eric | -- | -- | |
| Litteral Theresa L | -- | -- |
Source: Public Records
Mortgage History
| Date | Status | Borrower | Loan Amount |
|---|---|---|---|
| Previous Owner | Whitehead Wesley A | $349,200 |
Source: Public Records
Tax History Compared to Growth
Tax History
| Year | Tax Paid | Tax Assessment Tax Assessment Total Assessment is a certain percentage of the fair market value that is determined by local assessors to be the total taxable value of land and additions on the property. | Land | Improvement |
|---|---|---|---|---|
| 2024 | $6,360 | $123,430 | $17,850 | $105,580 |
| 2023 | $6,360 | $123,430 | $17,850 | $105,580 |
| 2022 | $5,034 | $80,680 | $11,670 | $69,010 |
| 2021 | $4,528 | $80,680 | $11,670 | $69,010 |
| 2020 | $4,541 | $80,680 | $11,670 | $69,010 |
| 2019 | $4,054 | $72,050 | $12,830 | $59,220 |
| 2018 | $4,100 | $72,050 | $12,830 | $59,220 |
| 2017 | $4,012 | $72,050 | $12,830 | $59,220 |
| 2016 | $4,038 | $70,890 | $11,670 | $59,220 |
| 2015 | $3,957 | $70,890 | $11,670 | $59,220 |
| 2014 | $3,957 | $70,890 | $11,670 | $59,220 |
| 2012 | -- | $65,780 | $11,670 | $54,110 |
Source: Public Records
Map
Nearby Homes
- 5423 Zachary Ln
- 5419 Zachary Ln
- 5415 Zachary Ln
- 5418 Zachary Ln
- 5411 Zachary Ln
- 5408 Zachary Ln
- 4403 Woodpoint Ct
- 4418 Woodpoint Ct
- 4294 Dobbin Cir
- 4288 Dobbin Cir
- 4416 Hawk Watch Way
- 4426 Rainbrook Way
- 4521 Willow Mist Dr
- 3513 Forest Ridge Blvd
- 3531 Forest Ridge Blvd
- 4330 Coach Light Trail
- 4734 Willow Mist Dr
- 5818 Royal Palm Ct
- 5612 Kitridge Rd
- 4183 Eagle Watch Way
- 4282 N Hyland Ave
- 4296 N Hyland Ave
- 7800 Union Schoolhouse Rd
- 7825 Union Schoolhouse Rd
- 7819 Union Schoolhouse Rd
- 4209 N Hyland Ave
- 4345 N Hyland Ave
- 4210 N Hyland Ave
- 7802 Union Schoolhouse Rd
- 4350 N Hyland Ave
- 7790 Union Schoolhouse Rd
- 4178 N Hyland Ave
- 7799 Union Schoolhouse Rd
- 4385 N Hyland Ave
- 4177 N Hyland Ave
- 4390 N Hyland Ave
- 4117 N Hyland Ave
- 4118 N Hyland Ave
- 4434 N Hyland Ave
- 7766 Union Schoolhouse Rd