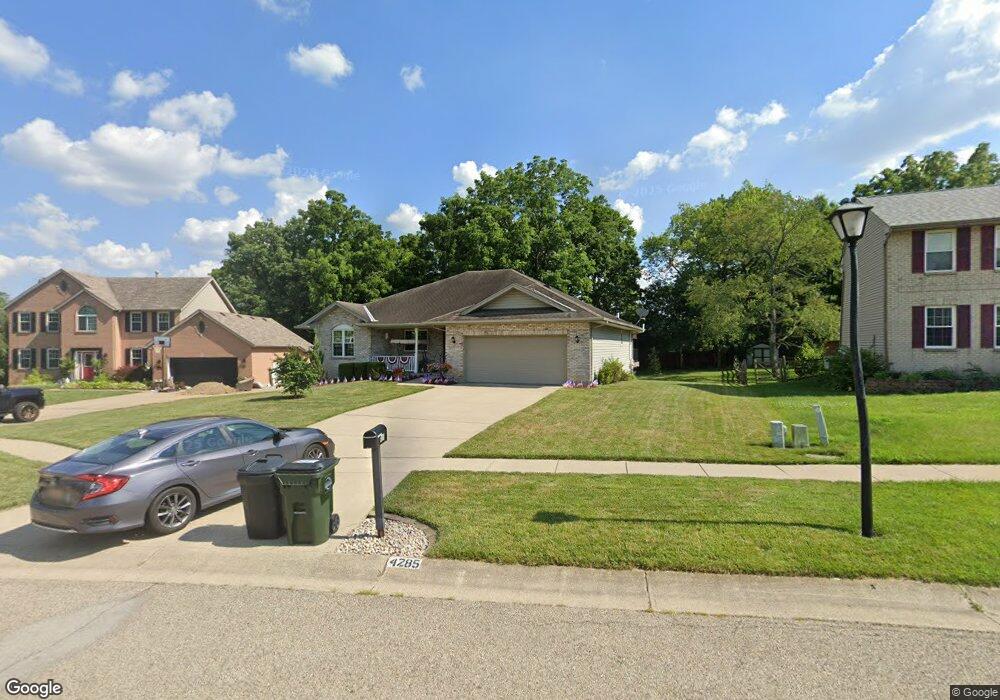
4285 Ryan Ct Liberty Township, OH 45011
Estimated Value: $326,000 - $401,000
3
Beds
2
Baths
1,556
Sq Ft
$233/Sq Ft
Est. Value
About This Home
This home is located at 4285 Ryan Ct, Liberty Township, OH 45011 and is currently estimated at $362,626, approximately $233 per square foot. 4285 Ryan Ct is a home located in Butler County with nearby schools including Heritage Early Childhood School, Cherokee Elementary School, and Lakota Plains Junior School.
Ownership History
Date
Name
Owned For
Owner Type
Purchase Details
Closed on
Jul 30, 2004
Sold by
Jones Robert F and Jones Judith A
Bought by
Meyer Robert Anthony and Meyer Denise
Current Estimated Value
Home Financials for this Owner
Home Financials are based on the most recent Mortgage that was taken out on this home.
Original Mortgage
$137,000
Interest Rate
6.34%
Mortgage Type
Purchase Money Mortgage
Purchase Details
Closed on
Sep 14, 2001
Sold by
Croucher Clyde and Croucher Joy L
Bought by
Jones Robert F and Jones Judith A
Home Financials for this Owner
Home Financials are based on the most recent Mortgage that was taken out on this home.
Original Mortgage
$130,000
Interest Rate
6.97%
Mortgage Type
Unknown
Purchase Details
Closed on
Apr 12, 1999
Sold by
Ricks Julie and Ricks Chad S
Bought by
Ricks Chad S and Ricks Julie
Home Financials for this Owner
Home Financials are based on the most recent Mortgage that was taken out on this home.
Original Mortgage
$129,600
Interest Rate
6.62%
Mortgage Type
Purchase Money Mortgage
Create a Home Valuation Report for This Property
The Home Valuation Report is an in-depth analysis detailing your home's value as well as a comparison with similar homes in the area
Home Values in the Area
Average Home Value in this Area
Purchase History
| Date | Buyer | Sale Price | Title Company |
|---|---|---|---|
| Meyer Robert Anthony | $204,000 | -- | |
| Jones Robert F | $173,300 | Prodigy Title Agency Inc | |
| Ricks Chad S | -- | -- |
Source: Public Records
Mortgage History
| Date | Status | Borrower | Loan Amount |
|---|---|---|---|
| Closed | Meyer Robert Anthony | $137,000 | |
| Closed | Jones Robert F | $130,000 | |
| Previous Owner | Ricks Chad S | $129,600 |
Source: Public Records
Tax History Compared to Growth
Tax History
| Year | Tax Paid | Tax Assessment Tax Assessment Total Assessment is a certain percentage of the fair market value that is determined by local assessors to be the total taxable value of land and additions on the property. | Land | Improvement |
|---|---|---|---|---|
| 2024 | $3,962 | $98,770 | $16,440 | $82,330 |
| 2023 | $3,910 | $96,730 | $16,440 | $80,290 |
| 2022 | $3,868 | $76,610 | $16,440 | $60,170 |
| 2021 | $3,848 | $76,610 | $16,440 | $60,170 |
| 2020 | $3,942 | $76,610 | $16,440 | $60,170 |
| 2019 | $5,970 | $61,970 | $16,820 | $45,150 |
| 2018 | $3,556 | $61,970 | $16,820 | $45,150 |
| 2017 | $3,528 | $61,970 | $16,820 | $45,150 |
| 2016 | $3,242 | $55,450 | $16,820 | $38,630 |
| 2015 | $3,187 | $55,450 | $16,820 | $38,630 |
| 2014 | $3,496 | $55,450 | $16,820 | $38,630 |
| 2013 | $3,496 | $57,130 | $16,820 | $40,310 |
Source: Public Records
Map
Nearby Homes
- 4296 Moselle Dr
- 6093 Griffin Ct
- 4300 Pheasant Trail Ct
- 6384 S Snowmass Dr
- 4077 Bramble Ct
- 6077 Snow Hill Dr
- 4600 Snowbird Dr
- 1 Princeton Rd
- 4004 Bayberry Dr
- 4628 Beech Knoll Ln
- 6406 Whippoorwill Dr
- 6406 Whippoorwill Way
- 4334 Palomino Ln
- 4328 Palomino Ln
- 4354 Cody Brook Dr
- 5870 Shetland Ct
- 5901 Jenny Marie Ct
- 4368 Stone Trace Ln
- 4925 Fescue Dr
- 6232 Hollyberry Ln