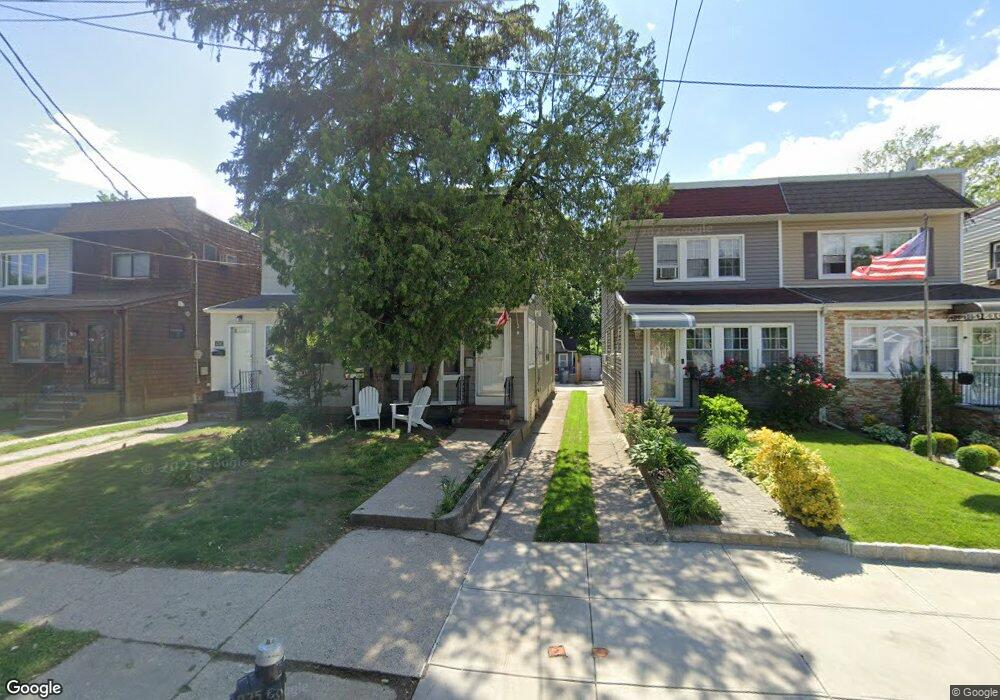
43-40 248th St Flushing, NY 11363
Douglaston NeighborhoodEstimated Value: $780,854 - $830,000
--
Bed
--
Bath
1,097
Sq Ft
$732/Sq Ft
Est. Value
About This Home
This home is located at 43-40 248th St, Flushing, NY 11363 and is currently estimated at $802,464, approximately $731 per square foot. 43-40 248th St is a home located in Queens County with nearby schools including P.S. 94 - David D. Porter, Louis Pasteur Middle School 67, and Benjamin N Cardozo High School.
Ownership History
Date
Name
Owned For
Owner Type
Purchase Details
Closed on
Jan 3, 2020
Sold by
Victorio Marc and Victorio Tara
Bought by
Victorio Marc
Current Estimated Value
Home Financials for this Owner
Home Financials are based on the most recent Mortgage that was taken out on this home.
Original Mortgage
$104,597
Outstanding Balance
$92,201
Interest Rate
3.7%
Mortgage Type
New Conventional
Estimated Equity
$710,263
Purchase Details
Closed on
Aug 20, 2007
Sold by
Fitzgerald Constance I
Bought by
Victorio Marc and Victorio Tara
Home Financials for this Owner
Home Financials are based on the most recent Mortgage that was taken out on this home.
Original Mortgage
$68,700
Interest Rate
6.71%
Purchase Details
Closed on
Jan 22, 1999
Sold by
Fitzgerald Constance I
Bought by
Fitzgerald Constance I
Create a Home Valuation Report for This Property
The Home Valuation Report is an in-depth analysis detailing your home's value as well as a comparison with similar homes in the area
Home Values in the Area
Average Home Value in this Area
Purchase History
| Date | Buyer | Sale Price | Title Company |
|---|---|---|---|
| Victorio Marc | $90,000 | -- | |
| Victorio Marc | $90,000 | -- | |
| Victorio Marc | $458,500 | -- | |
| Victorio Marc | $458,500 | -- | |
| Fitzgerald Constance I | -- | -- | |
| Fitzgerald Constance I | -- | -- |
Source: Public Records
Mortgage History
| Date | Status | Borrower | Loan Amount |
|---|---|---|---|
| Open | Victorio Marc | $104,597 | |
| Closed | Victorio Marc | $104,597 | |
| Previous Owner | Victorio Marc | $68,700 | |
| Previous Owner | Victorio Marc | $366,800 |
Source: Public Records
Tax History Compared to Growth
Tax History
| Year | Tax Paid | Tax Assessment Tax Assessment Total Assessment is a certain percentage of the fair market value that is determined by local assessors to be the total taxable value of land and additions on the property. | Land | Improvement |
|---|---|---|---|---|
| 2025 | $5,440 | $27,838 | $7,781 | $20,057 |
| 2024 | $5,440 | $27,086 | $7,561 | $19,525 |
| 2023 | $5,181 | $25,795 | $6,918 | $18,877 |
| 2022 | $4,892 | $48,180 | $13,500 | $34,680 |
| 2021 | $4,886 | $42,960 | $13,500 | $29,460 |
| 2020 | $4,910 | $43,200 | $13,500 | $29,700 |
| 2019 | $4,429 | $43,080 | $13,500 | $29,580 |
| 2018 | $4,084 | $21,496 | $7,641 | $13,855 |
| 2017 | $3,863 | $20,420 | $7,894 | $12,526 |
| 2016 | $3,558 | $20,420 | $7,894 | $12,526 |
| 2015 | $2,104 | $19,332 | $8,868 | $10,464 |
| 2014 | $2,104 | $18,810 | $9,558 | $9,252 |
Source: Public Records
Map
Nearby Homes
- 4330 248th St
- 43-17 248th St
- 4521 248th St
- 45-26 Zion St
- 4529 Marathon Pkwy
- 44-31 244th St
- 242-16 Pine St
- 24854 Thebes Ave
- 41-27 Orient Ave
- 41-33 248th St
- 248-14 Deepdale Ave
- 241-20 Northern Blvd Unit 6E
- 241-20 Northern Blvd Unit 3 H
- 241-20 Northern Blvd Unit 2H
- 241-20 Northern Blvd Unit 5B
- 241-20 Northern Blvd Unit 6H
- 241-20 Northern Blvd Unit 5E
- 241-20 Northern Blvd Unit 1M
- 241-20 Northern Blvd Unit 2C
- 24120 Northern Blvd Unit 4C