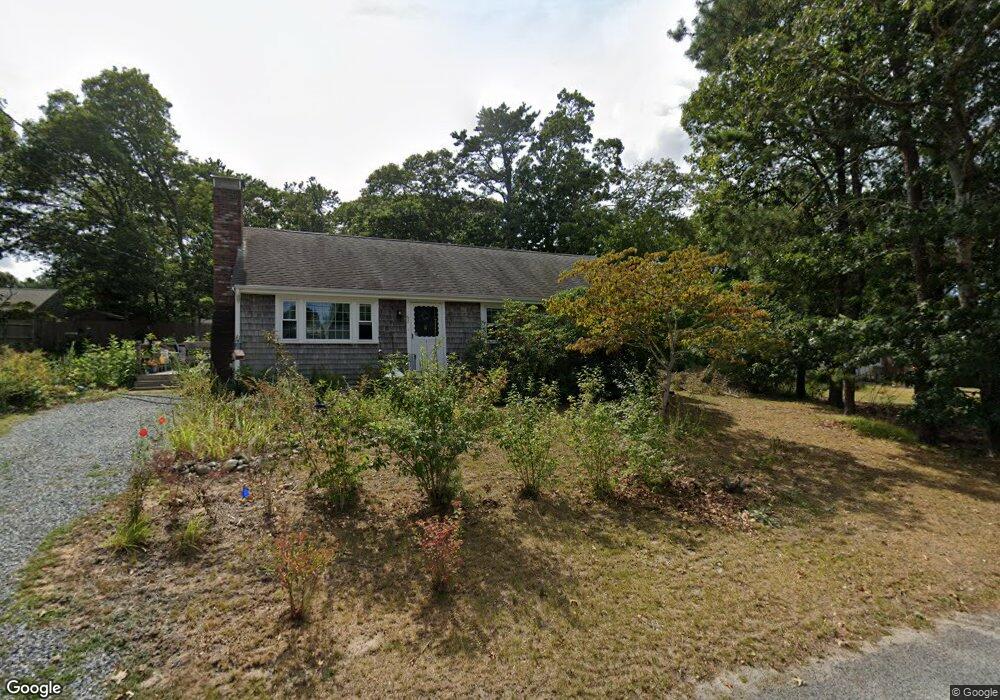
43 Agnes Rd South Dennis, MA 02660
South Dennis NeighborhoodEstimated Value: $552,489 - $632,000
3
Beds
1
Bath
1,001
Sq Ft
$579/Sq Ft
Est. Value
About This Home
This home is located at 43 Agnes Rd, South Dennis, MA 02660 and is currently estimated at $579,872, approximately $579 per square foot. 43 Agnes Rd is a home located in Barnstable County with nearby schools including Dennis-Yarmouth Regional High School and St. Pius X. School.
Ownership History
Date
Name
Owned For
Owner Type
Purchase Details
Closed on
Feb 25, 1993
Sold by
Dimatteo Donald T and Dimatteo Joanne C
Bought by
Floyd Patricia A
Current Estimated Value
Home Financials for this Owner
Home Financials are based on the most recent Mortgage that was taken out on this home.
Original Mortgage
$105,000
Interest Rate
8.03%
Mortgage Type
Purchase Money Mortgage
Create a Home Valuation Report for This Property
The Home Valuation Report is an in-depth analysis detailing your home's value as well as a comparison with similar homes in the area
Home Values in the Area
Average Home Value in this Area
Purchase History
| Date | Buyer | Sale Price | Title Company |
|---|---|---|---|
| Floyd Patricia A | $105,000 | -- |
Source: Public Records
Mortgage History
| Date | Status | Borrower | Loan Amount |
|---|---|---|---|
| Open | Floyd Patricia A | $28,308 | |
| Closed | Floyd Patricia A | $105,000 |
Source: Public Records
Tax History Compared to Growth
Tax History
| Year | Tax Paid | Tax Assessment Tax Assessment Total Assessment is a certain percentage of the fair market value that is determined by local assessors to be the total taxable value of land and additions on the property. | Land | Improvement |
|---|---|---|---|---|
| 2025 | $2,033 | $469,600 | $135,600 | $334,000 |
| 2024 | $1,879 | $428,100 | $130,400 | $297,700 |
| 2023 | $1,818 | $389,200 | $118,500 | $270,700 |
| 2022 | $1,791 | $319,800 | $118,600 | $201,200 |
| 2021 | $1,719 | $285,100 | $116,300 | $168,800 |
| 2020 | $1,644 | $269,500 | $116,300 | $153,200 |
| 2019 | $1,626 | $263,500 | $125,400 | $138,100 |
| 2018 | $1,485 | $234,300 | $108,600 | $125,700 |
| 2017 | $1,416 | $230,300 | $108,600 | $121,700 |
| 2016 | $1,310 | $200,600 | $114,000 | $86,600 |
| 2015 | $1,284 | $200,600 | $114,000 | $86,600 |
| 2014 | $1,274 | $200,700 | $97,700 | $103,000 |
Source: Public Records
Map
Nearby Homes
- 153 Bayridge Dr
- 17 Margate Ln
- 4 Ebb Rd
- 15 Captain Jud Rd
- 17 Fairmount Rd
- 17 Fairmount Rd
- 10 Joanne Dr
- 118 Driftwood Ln
- 129 Driftwood Ln
- 7 Vinland Dr
- 25 Skerry Rd
- 13 Covey Dr
- 111 Merchant Ave
- 1 Norseman Dr
- 62 Old Fish House Rd
- 6 Hawthorn St
- 4 Old Colony Way
- 6 Nimble Hill Dr
- 32 Captain Walsh Dr
- 59 Main St Unit 19-2