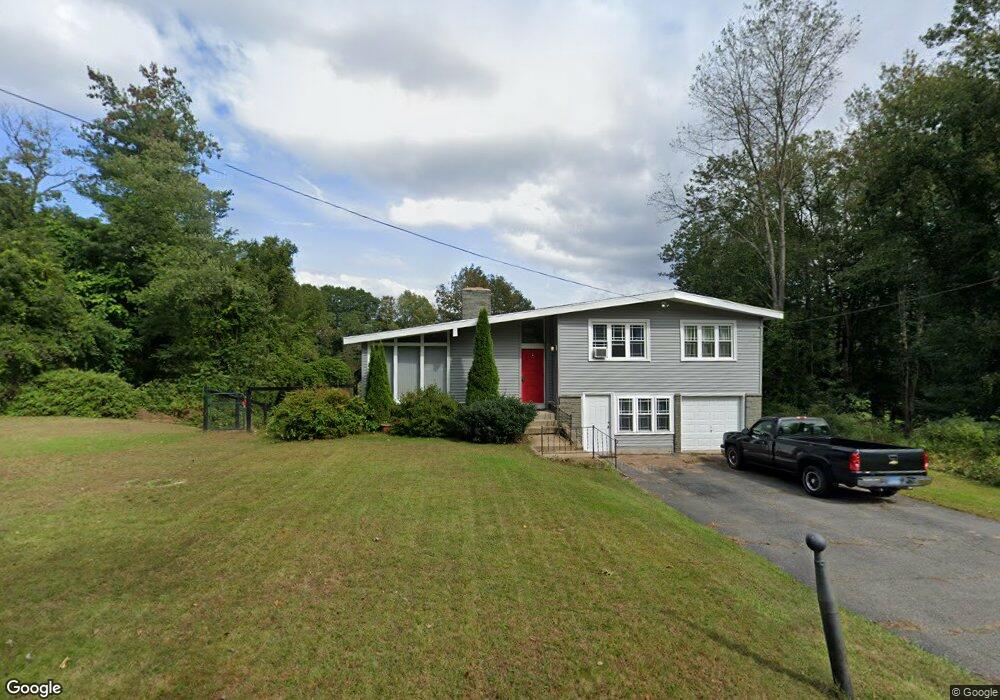
43 Cooper Ln Stafford Springs, CT 06076
Estimated Value: $346,000 - $388,000
3
Beds
2
Baths
1,203
Sq Ft
$306/Sq Ft
Est. Value
About This Home
This home is located at 43 Cooper Ln, Stafford Springs, CT 06076 and is currently estimated at $367,896, approximately $305 per square foot. 43 Cooper Ln is a home located in Tolland County with nearby schools including Stafford Elementary School, Stafford Middle School, and Stafford High School.
Ownership History
Date
Name
Owned For
Owner Type
Purchase Details
Closed on
Apr 3, 2018
Sold by
Lavault Richard E and Lavault Dorothy E
Bought by
Dollak Corey and Dollak Danielle
Current Estimated Value
Home Financials for this Owner
Home Financials are based on the most recent Mortgage that was taken out on this home.
Original Mortgage
$168,587
Outstanding Balance
$144,779
Interest Rate
4.38%
Mortgage Type
Purchase Money Mortgage
Estimated Equity
$223,117
Purchase Details
Closed on
May 4, 2000
Sold by
Mccloskey William and Mccloskey Wendy
Bought by
Lavault Richard and Lavault Dorothy
Home Financials for this Owner
Home Financials are based on the most recent Mortgage that was taken out on this home.
Original Mortgage
$138,037
Interest Rate
8.21%
Purchase Details
Closed on
Nov 3, 1997
Sold by
Irving Constance and Delorge Carol
Bought by
Mccloskey William and Mccloskey Wendy
Home Financials for this Owner
Home Financials are based on the most recent Mortgage that was taken out on this home.
Original Mortgage
$104,000
Interest Rate
7.25%
Mortgage Type
Unknown
Create a Home Valuation Report for This Property
The Home Valuation Report is an in-depth analysis detailing your home's value as well as a comparison with similar homes in the area
Home Values in the Area
Average Home Value in this Area
Purchase History
| Date | Buyer | Sale Price | Title Company |
|---|---|---|---|
| Dollak Corey | $180,000 | -- | |
| Lavault Richard | $151,000 | -- | |
| Mccloskey William | $130,000 | -- |
Source: Public Records
Mortgage History
| Date | Status | Borrower | Loan Amount |
|---|---|---|---|
| Open | Dollak Corey | $168,587 | |
| Previous Owner | Mccloskey William | $54,000 | |
| Previous Owner | Mccloskey William | $141,200 | |
| Previous Owner | Mccloskey William | $138,037 | |
| Previous Owner | Mccloskey William | $104,000 |
Source: Public Records
Tax History Compared to Growth
Tax History
| Year | Tax Paid | Tax Assessment Tax Assessment Total Assessment is a certain percentage of the fair market value that is determined by local assessors to be the total taxable value of land and additions on the property. | Land | Improvement |
|---|---|---|---|---|
| 2025 | $7,296 | $130,830 | $33,810 | $97,020 |
| 2024 | $5,049 | $130,830 | $33,810 | $97,020 |
| 2023 | $4,809 | $130,830 | $33,810 | $97,020 |
| 2022 | $4,681 | $130,830 | $33,810 | $97,020 |
| 2021 | $4,570 | $130,830 | $33,810 | $97,020 |
| 2020 | $4,746 | $135,870 | $39,270 | $96,600 |
| 2019 | $4,734 | $135,520 | $39,270 | $96,250 |
| 2018 | $4,643 | $135,520 | $39,270 | $96,250 |
| 2017 | $4,598 | $135,520 | $39,270 | $96,250 |
| 2016 | $1,997 | $135,520 | $39,270 | $96,250 |
| 2015 | $4,541 | $135,520 | $39,270 | $96,250 |
| 2014 | $4,476 | $135,520 | $39,270 | $96,250 |
Source: Public Records
Map
Nearby Homes
- 73 Cooper Ln
- 80 W Stafford Rd
- 44 Tolland Ave Unit 37
- 44 Tolland Ave Unit 46
- 44 Tolland Ave Unit 64
- 71 W Main St
- 115 W Stafford Rd
- 52 High St
- 0 Rockledge Rd Unit 24131563
- 4 Clinton St
- 30 Edgewood St
- 188B W Stafford Rd
- 0 Tolland Turnpike
- 92 Furnace Ave Unit 68
- 97 Orcuttville Rd
- 20 Grant Ave
- 200 Orcuttville Rd
- 8 Gale Rd
- 23 East St
- 116 Conklin Rd