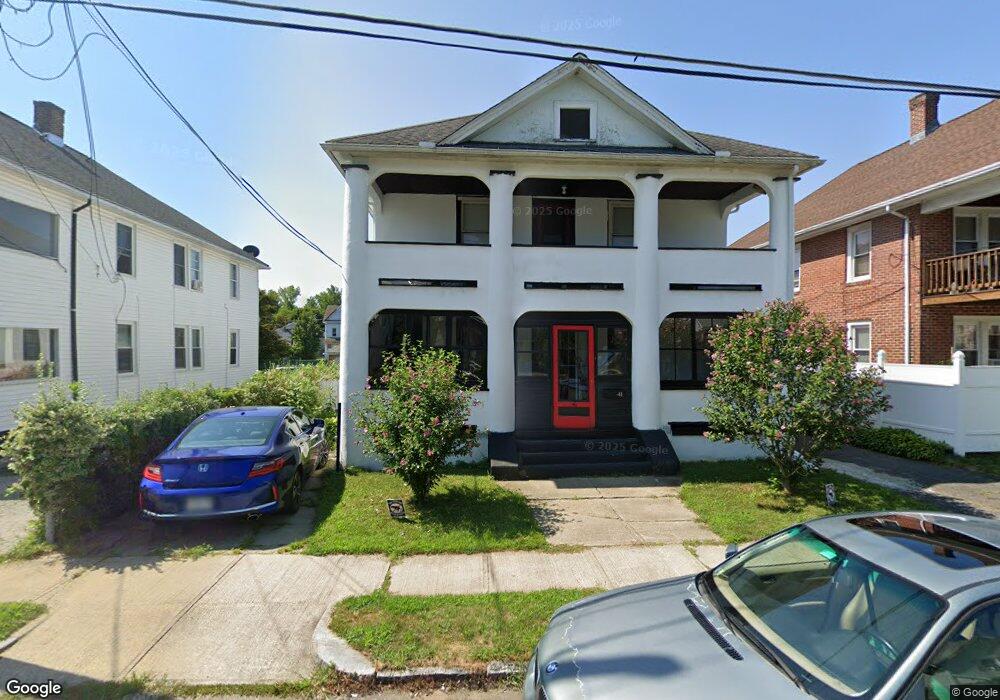
43 Quebec St Indian Orchard, MA 01151
Indian Orchard NeighborhoodEstimated Value: $257,000 - $363,000
4
Beds
2
Baths
1,788
Sq Ft
$176/Sq Ft
Est. Value
About This Home
This home is located at 43 Quebec St, Indian Orchard, MA 01151 and is currently estimated at $313,819, approximately $175 per square foot. 43 Quebec St is a home located in Hampden County with nearby schools including Indian Orchard Elementary School, John F. Kennedy Academy, and Roger L. Putnam Vocational Technical Academy.
Ownership History
Date
Name
Owned For
Owner Type
Purchase Details
Closed on
Sep 13, 2002
Sold by
Est Joao Jose and Joao Antonio L
Bought by
Lyons Peter D
Current Estimated Value
Home Financials for this Owner
Home Financials are based on the most recent Mortgage that was taken out on this home.
Original Mortgage
$68,000
Interest Rate
6.48%
Mortgage Type
Purchase Money Mortgage
Create a Home Valuation Report for This Property
The Home Valuation Report is an in-depth analysis detailing your home's value as well as a comparison with similar homes in the area
Home Values in the Area
Average Home Value in this Area
Purchase History
| Date | Buyer | Sale Price | Title Company |
|---|---|---|---|
| Lyons Peter D | $70,140 | -- | |
| Lyons Peter D | $70,140 | -- |
Source: Public Records
Mortgage History
| Date | Status | Borrower | Loan Amount |
|---|---|---|---|
| Previous Owner | Lyons Peter D | $68,000 |
Source: Public Records
Tax History Compared to Growth
Tax History
| Year | Tax Paid | Tax Assessment Tax Assessment Total Assessment is a certain percentage of the fair market value that is determined by local assessors to be the total taxable value of land and additions on the property. | Land | Improvement |
|---|---|---|---|---|
| 2025 | $4,085 | $260,500 | $43,000 | $217,500 |
| 2024 | $3,710 | $231,000 | $40,200 | $190,800 |
| 2023 | $3,396 | $199,200 | $33,000 | $166,200 |
| 2022 | $3,201 | $170,100 | $30,800 | $139,300 |
| 2021 | $3,101 | $164,100 | $28,000 | $136,100 |
| 2020 | $3,066 | $157,000 | $28,000 | $129,000 |
| 2019 | $2,700 | $137,200 | $29,000 | $108,200 |
| 2018 | $2,535 | $128,800 | $29,000 | $99,800 |
| 2017 | $2,515 | $127,900 | $24,700 | $103,200 |
| 2016 | $2,194 | $111,600 | $24,700 | $86,900 |
| 2015 | $2,116 | $107,600 | $24,700 | $82,900 |
Source: Public Records
Map
Nearby Homes
- 295 Main St
- 36-38 Montcalm St
- 96 Lyons St
- 20 Connolly St
- 25 Burke St
- 34-36 Mazarin St
- 27 Goodwin St
- 0 Parker St (Ws) Unit 73388310
- 63 Parker St
- 201 Main St
- 105 Mazarin St
- 0 Center St Unit 73415933
- 166-168 Main St
- 188B Parker St
- 130 Mazarin St
- 188 Parker St
- 189 Essex St Unit H
- 1200 Worcester St
- 13 - 13.5 Weston St
- 24 Elm St
- 45 Quebec St Unit 47
- 39 Quebec St
- 364 Main St Unit 366
- 372 Main St Unit 374
- 364-366 Main St
- 42 Quebec St Unit 44
- 40 Quebec St
- 46 Quebec St Unit 48
- 376-378 Main St
- 376 Main St Unit 378
- 354 Main St
- 34 Quebec St
- 50 Quebec St Unit 52
- 30 Quebec St Unit 32
- 57 Quebec St Unit 59
- 57-59 Quebec St
- 54 Quebec St Unit 56
- 0 Quebec St (Ss) Unit 73010742
- 58-60 Quebec St
- 26 Quebec St Unit 28