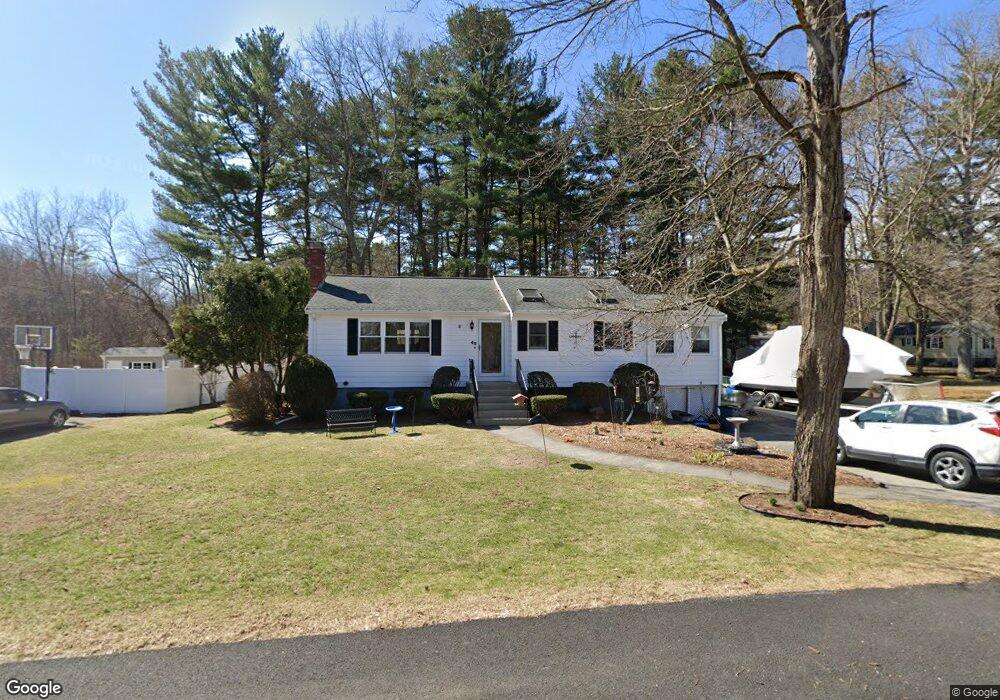
43 Shady Lane Dr Wilmington, MA 01887
North Wilmington NeighborhoodEstimated Value: $666,020 - $785,000
3
Beds
1
Bath
1,074
Sq Ft
$666/Sq Ft
Est. Value
About This Home
This home is located at 43 Shady Lane Dr, Wilmington, MA 01887 and is currently estimated at $715,755, approximately $666 per square foot. 43 Shady Lane Dr is a home located in Middlesex County with nearby schools including Wilmington Middle School, Wilmington High School, and Abundant Life Christian School and Childcare.
Ownership History
Date
Name
Owned For
Owner Type
Purchase Details
Closed on
Feb 27, 1998
Sold by
Mirabella Joseph A and Mirabella Paula Marabella
Bought by
Farrell Timothy M
Current Estimated Value
Home Financials for this Owner
Home Financials are based on the most recent Mortgage that was taken out on this home.
Original Mortgage
$148,500
Outstanding Balance
$26,759
Interest Rate
6.85%
Mortgage Type
Purchase Money Mortgage
Estimated Equity
$688,996
Purchase Details
Closed on
Nov 29, 1991
Sold by
Rybicki Edward and Rybicki Arlene
Bought by
Mirabella Joseph
Home Financials for this Owner
Home Financials are based on the most recent Mortgage that was taken out on this home.
Original Mortgage
$137,970
Interest Rate
8.72%
Mortgage Type
Purchase Money Mortgage
Create a Home Valuation Report for This Property
The Home Valuation Report is an in-depth analysis detailing your home's value as well as a comparison with similar homes in the area
Home Values in the Area
Average Home Value in this Area
Purchase History
| Date | Buyer | Sale Price | Title Company |
|---|---|---|---|
| Farrell Timothy M | $186,500 | -- | |
| Mirabella Joseph | $150,000 | -- |
Source: Public Records
Mortgage History
| Date | Status | Borrower | Loan Amount |
|---|---|---|---|
| Open | Mirabella Joseph | $148,500 | |
| Previous Owner | Mirabella Joseph | $137,970 |
Source: Public Records
Tax History Compared to Growth
Tax History
| Year | Tax Paid | Tax Assessment Tax Assessment Total Assessment is a certain percentage of the fair market value that is determined by local assessors to be the total taxable value of land and additions on the property. | Land | Improvement |
|---|---|---|---|---|
| 2025 | $6,036 | $527,200 | $304,900 | $222,300 |
| 2024 | $5,827 | $509,800 | $304,900 | $204,900 |
| 2023 | $5,634 | $471,900 | $277,200 | $194,700 |
| 2022 | $5,318 | $408,100 | $230,900 | $177,200 |
| 2021 | $5,279 | $381,400 | $209,900 | $171,500 |
| 2020 | $5,159 | $379,900 | $209,900 | $170,000 |
| 2019 | $5,064 | $368,300 | $199,800 | $168,500 |
| 2018 | $4,734 | $328,500 | $190,400 | $138,100 |
| 2017 | $4,584 | $317,200 | $189,000 | $128,200 |
| 2016 | $4,395 | $300,400 | $180,100 | $120,300 |
| 2015 | $4,174 | $290,500 | $180,100 | $110,400 |
| 2014 | $3,888 | $273,000 | $171,600 | $101,400 |
Source: Public Records
Map
Nearby Homes
- 41 Shady Lane Dr
- 68 Lawrence St
- 45 Shady Lane Dr
- 66 Lawrence St
- 74 Lawrence St
- 64 Lawrence St
- 73 Lawrence St
- 71 Lawrence St
- 69 Lawrence St
- 75 Lawrence St
- 62 Lawrence St
- 67 Lawrence St
- 38 Shady Lane Dr
- 77 Lawrence St
- 60 Lawrence St
- 65 Lawrence St
- 35 Shady Lane Dr
- 36 Shady Lane Dr
- 3 Sprucewood Rd
- 63 Lawrence St