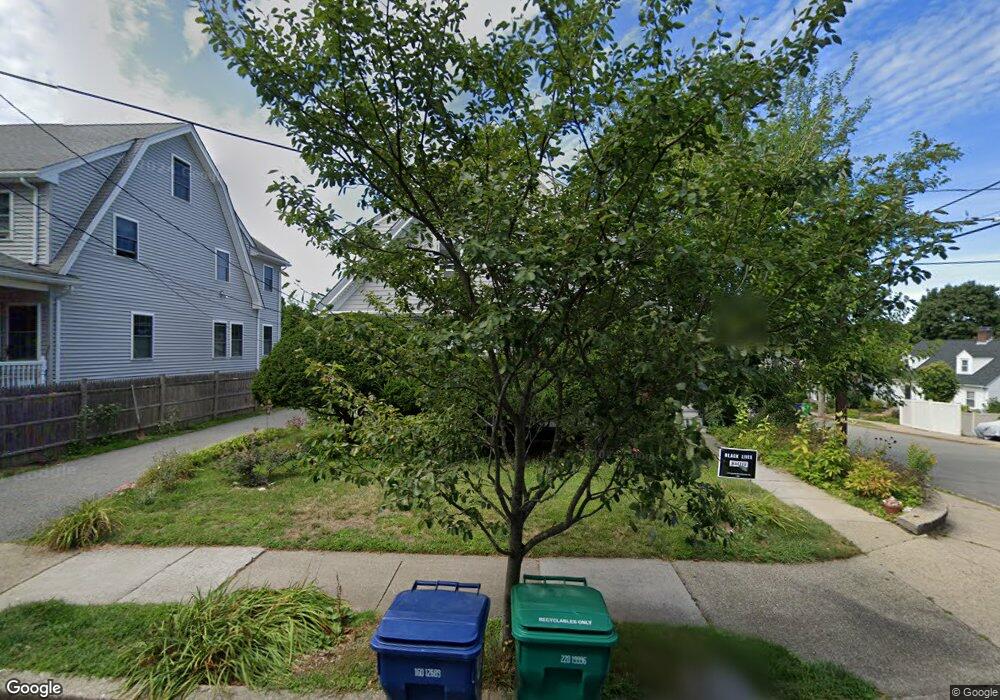
43 Wyoming Rd Newtonville, MA 02460
Nonantum NeighborhoodEstimated Value: $1,249,158 - $1,318,000
4
Beds
2
Baths
1,913
Sq Ft
$670/Sq Ft
Est. Value
About This Home
This home is located at 43 Wyoming Rd, Newtonville, MA 02460 and is currently estimated at $1,281,040, approximately $669 per square foot. 43 Wyoming Rd is a home located in Middlesex County with nearby schools including Horace Mann Elementary School, F.A. Day Middle School, and Newton North High School.
Ownership History
Date
Name
Owned For
Owner Type
Purchase Details
Closed on
Sep 16, 1997
Sold by
Tibbetts Bruce A and Tibbetts Connolly-Tibbetts M
Bought by
Netsky Hankus and Brooks Beth J
Current Estimated Value
Home Financials for this Owner
Home Financials are based on the most recent Mortgage that was taken out on this home.
Original Mortgage
$179,000
Outstanding Balance
$27,350
Interest Rate
7.31%
Mortgage Type
Purchase Money Mortgage
Estimated Equity
$1,253,690
Purchase Details
Closed on
Aug 1, 1994
Sold by
Mccarthy Joseph and Mccarthy Mary P
Bought by
Tibbetts Bruce A and Connolly-Tibbetts Marg
Home Financials for this Owner
Home Financials are based on the most recent Mortgage that was taken out on this home.
Original Mortgage
$160,000
Interest Rate
8.25%
Mortgage Type
Purchase Money Mortgage
Create a Home Valuation Report for This Property
The Home Valuation Report is an in-depth analysis detailing your home's value as well as a comparison with similar homes in the area
Home Values in the Area
Average Home Value in this Area
Purchase History
| Date | Buyer | Sale Price | Title Company |
|---|---|---|---|
| Netsky Hankus | $259,000 | -- | |
| Tibbetts Bruce A | $230,000 | -- |
Source: Public Records
Mortgage History
| Date | Status | Borrower | Loan Amount |
|---|---|---|---|
| Open | Tibbetts Bruce A | $30,000 | |
| Open | Tibbetts Bruce A | $179,000 | |
| Previous Owner | Tibbetts Bruce A | $160,000 |
Source: Public Records
Tax History Compared to Growth
Tax History
| Year | Tax Paid | Tax Assessment Tax Assessment Total Assessment is a certain percentage of the fair market value that is determined by local assessors to be the total taxable value of land and additions on the property. | Land | Improvement |
|---|---|---|---|---|
| 2025 | $9,108 | $929,400 | $796,700 | $132,700 |
| 2024 | $8,806 | $902,300 | $773,500 | $128,800 |
| 2023 | $8,215 | $807,000 | $583,700 | $223,300 |
| 2022 | $7,861 | $747,200 | $540,500 | $206,700 |
| 2021 | $7,585 | $704,900 | $509,900 | $195,000 |
| 2020 | $7,359 | $704,900 | $509,900 | $195,000 |
| 2019 | $7,152 | $684,400 | $495,000 | $189,400 |
| 2018 | $6,813 | $629,700 | $448,700 | $181,000 |
| 2017 | $6,606 | $594,100 | $423,300 | $170,800 |
| 2016 | $6,318 | $555,200 | $395,600 | $159,600 |
| 2015 | $6,024 | $518,900 | $369,700 | $149,200 |
Source: Public Records
Map
Nearby Homes
- 177 Nevada St
- 191 Linwood Ave
- 286 Nevada St Unit 286
- 282 Nevada St Unit 282
- 57 Walnut St
- 354 Linwood Ave Unit 1
- 1 Farwell Cir
- 611 Watertown St Unit 14
- 42-44 Judkins St
- 3 Repton Cir Unit 3204
- 321 Albemarle Rd
- 32-34 Rossmere St
- 158 Adams St
- 49 Hawthorn St
- 168 Walnut St
- 3 Ashmont Ave
- 34 West St Unit A
- 188-190 Adams St
- 11 Murphy Ct
- 53 West St