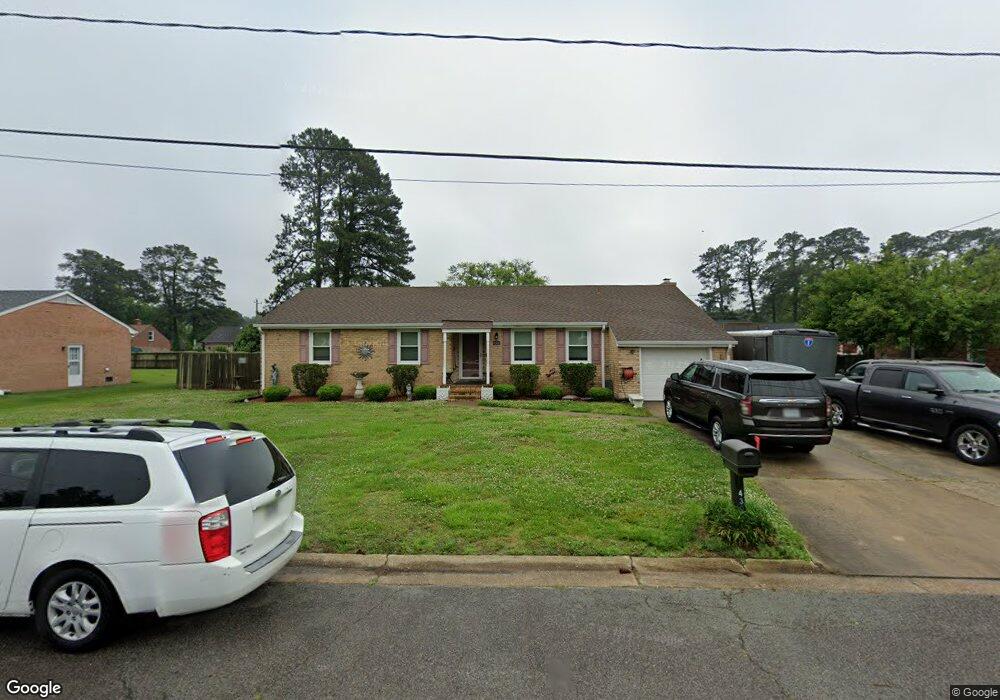
4301 Templar Dr Portsmouth, VA 23703
Churchland NeighborhoodEstimated Value: $344,818 - $366,000
4
Beds
2
Baths
1,639
Sq Ft
$216/Sq Ft
Est. Value
About This Home
This home is located at 4301 Templar Dr, Portsmouth, VA 23703 and is currently estimated at $353,955, approximately $215 per square foot. 4301 Templar Dr is a home located in Portsmouth City with nearby schools including Churchland Elementary School, Churchland Academy Elementary School, and Churchland Middle School.
Ownership History
Date
Name
Owned For
Owner Type
Purchase Details
Closed on
Sep 25, 2019
Sold by
Bell Michael J
Bought by
Bell Michael J and Bell Jacqueline O
Current Estimated Value
Purchase Details
Closed on
Jun 15, 2011
Sold by
Sec Of Veterans Affairs
Bought by
Bell Michael J
Home Financials for this Owner
Home Financials are based on the most recent Mortgage that was taken out on this home.
Original Mortgage
$166,567
Outstanding Balance
$115,061
Interest Rate
4.75%
Mortgage Type
FHA
Estimated Equity
$238,894
Purchase Details
Closed on
Feb 23, 2011
Sold by
Glasser And Glasser Plc and Winer Matthew E
Bought by
Suntrust Mortgage Inc
Purchase Details
Closed on
Jun 13, 2006
Sold by
Norris Pamela M
Bought by
Winer Matthew E
Home Financials for this Owner
Home Financials are based on the most recent Mortgage that was taken out on this home.
Original Mortgage
$255,350
Interest Rate
6.62%
Mortgage Type
VA
Create a Home Valuation Report for This Property
The Home Valuation Report is an in-depth analysis detailing your home's value as well as a comparison with similar homes in the area
Home Values in the Area
Average Home Value in this Area
Purchase History
| Date | Buyer | Sale Price | Title Company |
|---|---|---|---|
| Bell Michael J | -- | None Available | |
| Bell Michael J | $170,900 | -- | |
| Suntrust Mortgage Inc | $163,041 | -- | |
| Winer Matthew E | $250,000 | -- |
Source: Public Records
Mortgage History
| Date | Status | Borrower | Loan Amount |
|---|---|---|---|
| Open | Bell Michael J | $166,567 | |
| Previous Owner | Winer Matthew E | $255,350 |
Source: Public Records
Tax History Compared to Growth
Tax History
| Year | Tax Paid | Tax Assessment Tax Assessment Total Assessment is a certain percentage of the fair market value that is determined by local assessors to be the total taxable value of land and additions on the property. | Land | Improvement |
|---|---|---|---|---|
| 2025 | $3,846 | $301,830 | $95,870 | $205,960 |
| 2024 | $3,846 | $298,780 | $95,870 | $202,910 |
| 2023 | $3,601 | $288,100 | $95,870 | $192,230 |
| 2022 | $3,319 | $255,340 | $79,890 | $175,450 |
| 2021 | $2,921 | $224,710 | $61,460 | $163,250 |
| 2020 | $2,843 | $218,720 | $58,530 | $160,190 |
| 2019 | $2,744 | $211,100 | $58,530 | $152,570 |
| 2018 | $2,705 | $208,050 | $58,530 | $149,520 |
| 2017 | $2,705 | $208,050 | $58,530 | $149,520 |
| 2016 | $2,615 | $201,140 | $58,530 | $142,610 |
| 2015 | $2,615 | $201,140 | $58,530 | $142,610 |
| 2014 | $2,554 | $201,140 | $58,530 | $142,610 |
Source: Public Records
Map
Nearby Homes
- 3405 Canterbury Dr
- 4313 Templar Dr
- 3408 Wakefield Dr
- 4705 Templar Dr
- 3200 Westwood Crescent
- 3425 Cedar Ln
- 3509 Spence Rd
- 5006 High St W
- 3233 Clover Hill Dr
- 5220 Clover Hill Dr
- 3205 Clover Hill Dr
- 4417 Gannon Rd
- 3613 Cardinal Ln
- 4707 High St W
- 4808 Thornwood St
- 4412 Carlton Ct
- 5221 High St W
- 4011 Reese Dr S
- 4955 Briarwood Ln
- 4959 Briarwood Ln
- 4209 Templar Dr
- 4305 Templar Dr
- 4808 Hatton Point Rd
- 4812 Hatton Point Rd
- 4804 Hatton Point Rd
- 3401 Canterbury Dr
- 4309 Templar Dr
- 4205 Templar Dr
- 4204 Templar Dr
- 4738 Hatton Point Rd
- 4828 Hatton Point Rd
- 3401 Wilshire Rd
- 3404 Canterbury Dr
- 4805 Hatton Point Rd
- 4201 Templar Dr
- 4809 Hatton Point Rd
- 4801 Hatton Point Rd
- 4308 Templar Dr
- 4900 Hatton Point Rd
- 4734 Hatton Point Rd