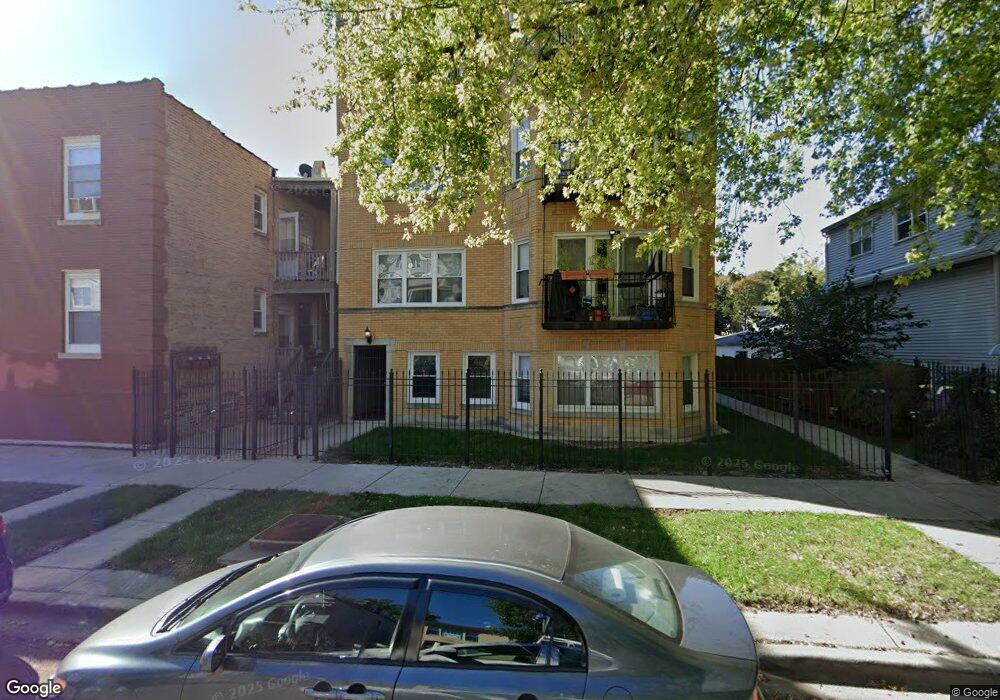
4304 N Saint Louis Ave Unit 430 Chicago, IL 60618
Irving Park NeighborhoodEstimated Value: $231,000 - $243,000
2
Beds
1
Bath
800
Sq Ft
$296/Sq Ft
Est. Value
About This Home
This home is located at 4304 N Saint Louis Ave Unit 430, Chicago, IL 60618 and is currently estimated at $236,635, approximately $295 per square foot. 4304 N Saint Louis Ave Unit 430 is a home located in Cook County with nearby schools including Henry Elementary School and Roosevelt High School.
Ownership History
Date
Name
Owned For
Owner Type
Purchase Details
Closed on
Feb 2, 2022
Sold by
3317 Potomac Llc
Bought by
Mannix Michael N
Current Estimated Value
Purchase Details
Closed on
Dec 27, 2021
Sold by
3317 Potomac Llc
Bought by
Mannix Michael N
Purchase Details
Closed on
Dec 12, 2016
Sold by
Fannie Mae
Bought by
Kenwood Training Center Inc
Purchase Details
Closed on
Jul 25, 2016
Sold by
Dedej Lech
Bought by
Federal National Mortgage Association
Purchase Details
Closed on
Sep 18, 2006
Sold by
Living Stone I Llc
Bought by
Dadej Lech and Sowinska Alina
Home Financials for this Owner
Home Financials are based on the most recent Mortgage that was taken out on this home.
Original Mortgage
$129,600
Interest Rate
8.69%
Mortgage Type
Unknown
Create a Home Valuation Report for This Property
The Home Valuation Report is an in-depth analysis detailing your home's value as well as a comparison with similar homes in the area
Home Values in the Area
Average Home Value in this Area
Purchase History
| Date | Buyer | Sale Price | Title Company |
|---|---|---|---|
| Mannix Michael N | $193,000 | -- | |
| Mannix Michael N | $193,000 | -- | |
| Kenwood Training Center Inc | -- | Chicago Title | |
| Federal National Mortgage Association | -- | Premier Title | |
| Dadej Lech | $144,000 | Stewart Title Of Illinois |
Source: Public Records
Mortgage History
| Date | Status | Borrower | Loan Amount |
|---|---|---|---|
| Previous Owner | Dadej Lech | $129,600 |
Source: Public Records
Tax History Compared to Growth
Tax History
| Year | Tax Paid | Tax Assessment Tax Assessment Total Assessment is a certain percentage of the fair market value that is determined by local assessors to be the total taxable value of land and additions on the property. | Land | Improvement |
|---|---|---|---|---|
| 2024 | $2,897 | $21,068 | $2,878 | $18,190 |
| 2023 | $3,509 | $17,000 | $2,321 | $14,679 |
| 2022 | $3,509 | $17,000 | $2,321 | $14,679 |
| 2021 | $3,430 | $16,999 | $2,320 | $14,679 |
| 2020 | $2,786 | $12,465 | $1,021 | $11,444 |
| 2019 | $2,798 | $13,878 | $1,021 | $12,857 |
| 2018 | $2,750 | $13,878 | $1,021 | $12,857 |
| 2017 | $2,293 | $10,615 | $928 | $9,687 |
| 2016 | $2,133 | $10,615 | $928 | $9,687 |
| 2015 | $1,952 | $10,615 | $928 | $9,687 |
| 2014 | $2,149 | $11,539 | $382 | $11,157 |
| 2013 | $2,106 | $11,539 | $382 | $11,157 |
Source: Public Records
Map
Nearby Homes
- 3550 W Montrose Ave Unit 107
- 4322 N Kimball Ave
- 4426 N Drake Ave
- 4249 N Central Park Ave
- 4246 N Kimball Ave
- 4207 N Drake Ave
- 4155 N Bernard St Unit G
- 4143 N Drake Ave
- 4534 N Saint Louis Ave
- 4304 N Lawndale Ave
- 4252 N Lawndale Ave
- 3707 W Cullom Ave Unit 1
- 4438 N Spaulding Ave
- 4248 N Sawyer Ave
- 3558 W Belle Plaine Ave Unit 3
- 3551 W Belle Plaine Ave Unit 2
- 3733 W Sunnyside Ave
- 3247 W Berteau Ave
- 4103 N Lawndale Ave Unit 202
- 4621 N Monticello Ave
- 4306 N Saint Louis Ave Unit 3D
- 4304 N Saint Louis Ave Unit 3S
- 4304 N Saint Louis Ave Unit 2S
- 4304 N Saint Louis Ave Unit 1S
- 4306 N Saint Louis Ave Unit 430
- 4306 N Saint Louis Ave Unit 430
- 4306 N Saint Louis Ave Unit 430
- 4304 N Saint Louis Ave Unit 430
- 4304 N Saint Louis Ave Unit 430
- 4304 N Saint Louis Ave Unit 430
- 4304 N Saint Louis Ave Unit 430
- 4304 N Saint Louis Ave Unit 430
- 4306 N Saint Louis Ave Unit 430
- 4306 N Saint Louis Ave Unit 430
- 4306 N Saint Louis Ave Unit 430
- 4304 N Saint Louis Ave Unit 430
- 4306 N Saint Louis Ave Unit GP
- 4306 N Saint Louis Ave Unit GP
- 4304 N Saint Louis Ave Unit 1A
- 4304 N Saint Louis Ave Unit 3A