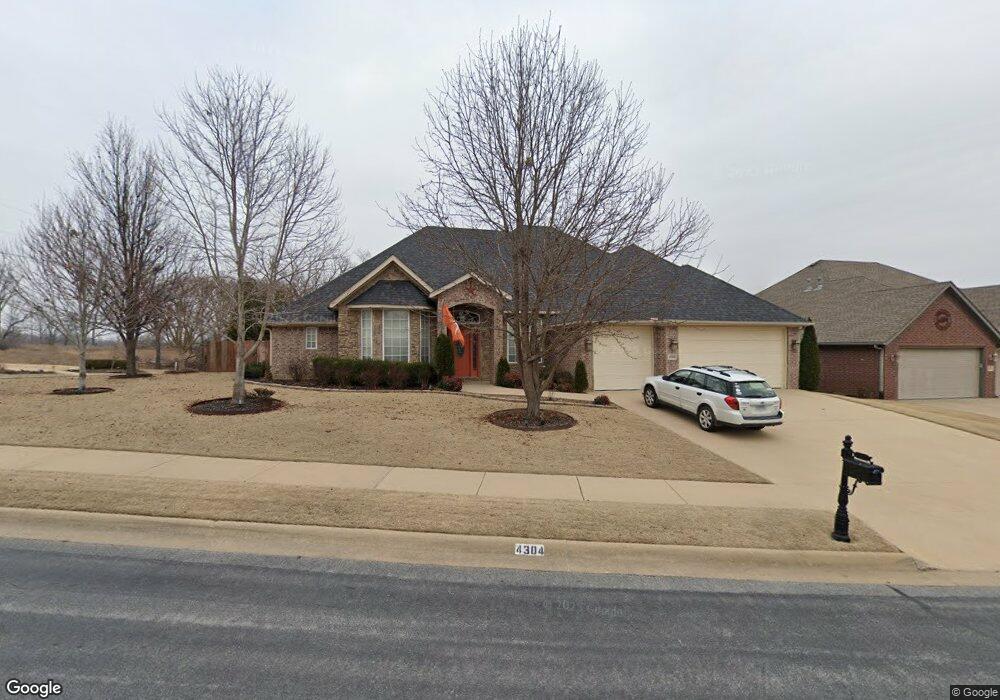
4304 NE Kensington Ave Bentonville, AR 72712
Estimated Value: $638,000 - $775,000
4
Beds
3
Baths
2,685
Sq Ft
$257/Sq Ft
Est. Value
About This Home
This home is located at 4304 NE Kensington Ave, Bentonville, AR 72712 and is currently estimated at $691,286, approximately $257 per square foot. 4304 NE Kensington Ave is a home located in Benton County with nearby schools including Ruth Barker Middle School, Apple Glen Elementary School, and Washington Junior High School.
Ownership History
Date
Name
Owned For
Owner Type
Purchase Details
Closed on
Sep 14, 2017
Sold by
Simmons Charles and Simmons Charles E
Bought by
Simmons Charles E
Current Estimated Value
Purchase Details
Closed on
Feb 23, 2009
Sold by
Prudential Relocation Inc
Bought by
Simmons Charles and Simmons Melissa
Home Financials for this Owner
Home Financials are based on the most recent Mortgage that was taken out on this home.
Original Mortgage
$200,000
Interest Rate
5.36%
Mortgage Type
Purchase Money Mortgage
Purchase Details
Closed on
Jan 11, 2007
Sold by
Dean Investments Inc
Bought by
Flajole Michael J and Flajole Windi M
Home Financials for this Owner
Home Financials are based on the most recent Mortgage that was taken out on this home.
Original Mortgage
$29,000
Interest Rate
6.1%
Mortgage Type
Credit Line Revolving
Create a Home Valuation Report for This Property
The Home Valuation Report is an in-depth analysis detailing your home's value as well as a comparison with similar homes in the area
Home Values in the Area
Average Home Value in this Area
Purchase History
| Date | Buyer | Sale Price | Title Company |
|---|---|---|---|
| Simmons Charles E | -- | None Available | |
| Simmons Charles | $270,000 | Heritage Land Title | |
| Flajole Michael J | $299,000 | None Available |
Source: Public Records
Mortgage History
| Date | Status | Borrower | Loan Amount |
|---|---|---|---|
| Closed | Simmons Charles | $200,000 | |
| Previous Owner | Flajole Michael J | $29,000 | |
| Previous Owner | Flajole Michael J | $239,200 |
Source: Public Records
Tax History Compared to Growth
Tax History
| Year | Tax Paid | Tax Assessment Tax Assessment Total Assessment is a certain percentage of the fair market value that is determined by local assessors to be the total taxable value of land and additions on the property. | Land | Improvement |
|---|---|---|---|---|
| 2025 | $4,751 | $126,307 | $19,600 | $106,707 |
| 2024 | $4,556 | $126,307 | $19,600 | $106,707 |
| 2023 | $4,339 | $82,890 | $16,000 | $66,890 |
| 2022 | $3,870 | $82,890 | $16,000 | $66,890 |
| 2021 | $3,670 | $82,890 | $16,000 | $66,890 |
| 2020 | $3,515 | $61,060 | $8,400 | $52,660 |
| 2019 | $3,376 | $61,060 | $8,400 | $52,660 |
| 2018 | $3,245 | $61,060 | $8,400 | $52,660 |
| 2017 | $2,830 | $61,060 | $8,400 | $52,660 |
| 2016 | $2,830 | $61,060 | $8,400 | $52,660 |
| 2015 | $3,034 | $49,090 | $7,400 | $41,690 |
| 2014 | $2,684 | $44,690 | $7,400 | $37,290 |
Source: Public Records
Map
Nearby Homes
- 4302 NE Kensington Ave
- 4205 NE Kenton Ave
- 4103 NE Kensington Ave
- 10 Spring Valley Rd
- 4006 NE Cadbury Ave
- 3907 NE Cadbury Ave
- 1402 NE Fairwinds Dr
- 1303 NE Fairwinds Dr
- 2001 NE Oak Trail Rd
- Lot 12 Woods Creek Rd
- Lot 14 Woods Creek Rd
- Lot 11 Woods Creek Rd
- Lot 13 Woods Creek Rd
- 1615 Cresent St
- 1210 Spring St
- 4502 NE Birchgrove Place
- 1810 NE Chaucer St
- 3808 Copper Ridge Rd
- 1905 NE Frost Dr
- 1907 NE Frost Dr
- 4203 Cascade Cove Cir
- 4305 NE Kensington Ave
- 4303 NE Kensington Ave
- 4198 N E Kensington
- 4198 NE Kensington St
- 4204 Cascade Cove Cir
- 4301 NE Kensington Ave
- 4200 NE Cascade Cove
- 4202 NE Cascade Cove
- 4206 NE Cascade Cove
- Lot 26 NE Cascade Cove
- 9986 Spring Valley Rd
- 9960 Spring Valley Rd
- 4201 NE Kenton Ave
- 4114 Kensington Ave
- 4203 NE Kensington Ave
- 9901 Spring Valley Rd
- 1703 NE Glade Terrace
- 4203 NE Kenton Ave
- 1705 NE Glade Terrace