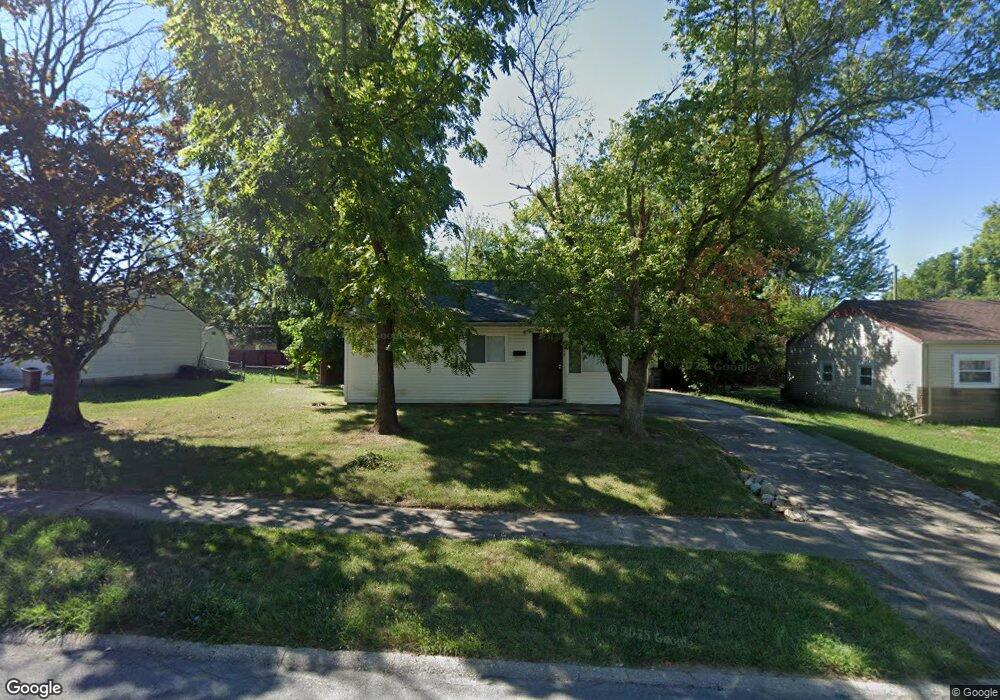
4308 Curundu Ave Dayton, OH 45416
Estimated Value: $82,000 - $91,000
3
Beds
1
Bath
864
Sq Ft
$100/Sq Ft
Est. Value
About This Home
This home is located at 4308 Curundu Ave, Dayton, OH 45416 and is currently estimated at $86,695, approximately $100 per square foot. 4308 Curundu Ave is a home located in Montgomery County with nearby schools including Valerie Elementary School, Imagine Klepinger Road Community School, and North Dayton School of Science & Discovery.
Ownership History
Date
Name
Owned For
Owner Type
Purchase Details
Closed on
Dec 4, 2015
Sold by
Re Home Solutions Llc
Bought by
Rhylee Ann Investments Llc
Current Estimated Value
Home Financials for this Owner
Home Financials are based on the most recent Mortgage that was taken out on this home.
Interest Rate
3.93%
Purchase Details
Closed on
Jan 30, 2014
Sold by
Hunter Robert
Bought by
Re Home Solution Llc
Purchase Details
Closed on
Jan 13, 2014
Sold by
Us Bank Na
Bought by
Hunter Robert
Purchase Details
Closed on
Oct 4, 2013
Sold by
Copprue Moses
Bought by
Us Bank Na Nd
Purchase Details
Closed on
Oct 1, 2013
Sold by
Copprue Moses
Bought by
U S Bank Na
Purchase Details
Closed on
May 7, 2004
Sold by
Campbell Charles W
Bought by
Copprue Moses
Purchase Details
Closed on
Mar 31, 2000
Sold by
Estate Of Wanda L Campbell
Bought by
Campbell John P and Campbell Charles W
Purchase Details
Closed on
Mar 29, 2000
Sold by
Campbell John P
Bought by
Campbell Charles W
Create a Home Valuation Report for This Property
The Home Valuation Report is an in-depth analysis detailing your home's value as well as a comparison with similar homes in the area
Home Values in the Area
Average Home Value in this Area
Purchase History
| Date | Buyer | Sale Price | Title Company |
|---|---|---|---|
| Rhylee Ann Investments Llc | $32,700 | -- | |
| Re Home Solution Llc | -- | None Available | |
| Hunter Robert | $7,700 | None Available | |
| Us Bank Na Nd | $20,000 | None Available | |
| U S Bank Na | $20,000 | None Available | |
| Copprue Moses | $40,000 | -- | |
| Campbell John P | -- | -- | |
| Campbell Charles W | -- | -- |
Source: Public Records
Mortgage History
| Date | Status | Borrower | Loan Amount |
|---|---|---|---|
| Closed | Rhylee Ann Investments Llc | -- |
Source: Public Records
Tax History Compared to Growth
Tax History
| Year | Tax Paid | Tax Assessment Tax Assessment Total Assessment is a certain percentage of the fair market value that is determined by local assessors to be the total taxable value of land and additions on the property. | Land | Improvement |
|---|---|---|---|---|
| 2024 | $1,192 | $14,480 | $3,480 | $11,000 |
| 2023 | $1,192 | $14,480 | $3,480 | $11,000 |
| 2022 | $1,330 | $12,250 | $2,950 | $9,300 |
| 2021 | $1,322 | $12,250 | $2,950 | $9,300 |
| 2020 | $1,305 | $12,250 | $2,950 | $9,300 |
| 2019 | $1,362 | $11,530 | $2,950 | $8,580 |
| 2018 | $1,238 | $11,530 | $2,950 | $8,580 |
| 2017 | $1,230 | $11,530 | $2,950 | $8,580 |
| 2016 | $1,105 | $11,530 | $2,950 | $8,580 |
| 2015 | $1,170 | $11,530 | $2,950 | $8,580 |
| 2014 | $1,722 | $11,530 | $2,950 | $8,580 |
| 2012 | -- | $14,690 | $3,930 | $10,760 |
Source: Public Records
Map
Nearby Homes
- 4237 Nevada Ave
- 4322 Annapolis Ave
- 4472 Curundu Ave
- 4235 Merryfield Ave
- 4131 Merryfield Ave
- 3462 Arlene Ave
- 3678 Wilmore St
- 3997 Mayview Dr
- 4180 Indian Ln
- 4703 Natchez Ave
- 4104 Brenton Dr
- LOT#26 Glenbrook Dr
- 2610 Marchmont Dr
- Lot#14 Bridgeport Dr
- Lot#15 Bridgeport Dr
- Lot#24 Glenbrook Dr
- Lot#1 Glenbrook Dr
- Lot#21 Glenbrook Dr
- Lot#25 Glenbrook Dr
- 4831 Free Pike
- 4322 Curundu Ave
- 4298 Curundu Ave
- 3753 Parkfield Place
- 4336 Curundu Ave
- 3739 Parkfield Place
- 4329 Catalina Ave
- 4337 Catalina Ave
- 4313 Curundu Ave
- 4299 Curundu Ave
- 4327 Curundu Ave
- 4348 Curundu Ave
- 3727 Parkfield Place
- 4347 Catalina Ave
- 3754 Parkfield Place
- 4285 Curundu Ave
- 4339 Curundu Ave
- 4321 Catalina Ave
- 3734 Parkfield Place
- 4362 Curundu Ave
- 4271 Curundu Ave