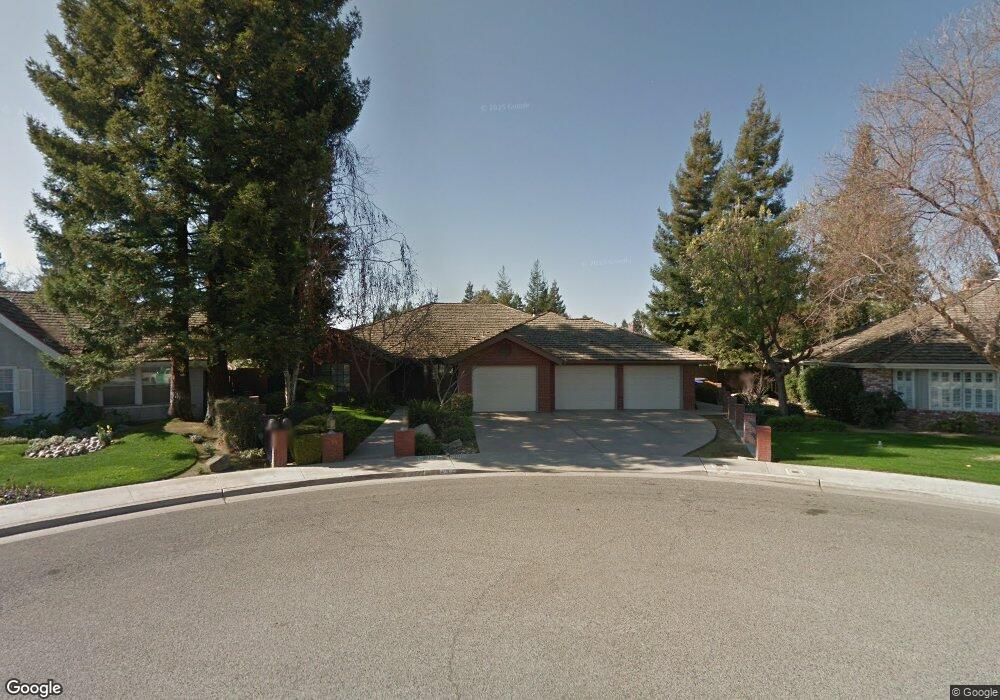
431 N Jennifer Way Porterville, CA 93257
Porterville Northwest NeighborhoodEstimated Value: $441,889 - $560,000
--
Bed
--
Bath
2,162
Sq Ft
$226/Sq Ft
Est. Value
About This Home
This home is located at 431 N Jennifer Way, Porterville, CA 93257 and is currently estimated at $487,722, approximately $225 per square foot. 431 N Jennifer Way is a home located in Tulare County with nearby schools including William R. Buckley Elementary School, Burton Middle School, and Monache High School.
Ownership History
Date
Name
Owned For
Owner Type
Purchase Details
Closed on
Dec 31, 2016
Sold by
Sullivan Thomas J O
Bought by
Sullivan Thomas J O and Sullivan Deborah L O
Current Estimated Value
Purchase Details
Closed on
Feb 15, 1995
Sold by
Lee Claude E
Bought by
Osullivan Thomas J and Osullivan Deborah
Home Financials for this Owner
Home Financials are based on the most recent Mortgage that was taken out on this home.
Original Mortgage
$125,000
Interest Rate
9.23%
Mortgage Type
Seller Take Back
Purchase Details
Closed on
May 23, 1994
Sold by
Crowe Donald O
Bought by
Lee Mark S and Lee Theresia L
Purchase Details
Closed on
Sep 15, 1993
Sold by
Schwammel John L
Bought by
Lee Mark S
Purchase Details
Closed on
Sep 9, 1993
Sold by
Lee Theresia L
Bought by
Lee Mark S
Create a Home Valuation Report for This Property
The Home Valuation Report is an in-depth analysis detailing your home's value as well as a comparison with similar homes in the area
Home Values in the Area
Average Home Value in this Area
Purchase History
| Date | Buyer | Sale Price | Title Company |
|---|---|---|---|
| Sullivan Thomas J O | -- | None Available | |
| Osullivan Thomas J | $209,500 | Chicago Title Company | |
| Lee Mark S | $8,500 | First American Title Ins Co | |
| Lee Mark S | $22,000 | Chicago Title Company | |
| Lee Mark S | -- | Chicago Title Company |
Source: Public Records
Mortgage History
| Date | Status | Borrower | Loan Amount |
|---|---|---|---|
| Previous Owner | Osullivan Thomas J | $125,000 |
Source: Public Records
Tax History Compared to Growth
Tax History
| Year | Tax Paid | Tax Assessment Tax Assessment Total Assessment is a certain percentage of the fair market value that is determined by local assessors to be the total taxable value of land and additions on the property. | Land | Improvement |
|---|---|---|---|---|
| 2025 | $3,821 | $351,691 | $64,668 | $287,023 |
| 2024 | $3,821 | $344,796 | $63,400 | $281,396 |
| 2023 | $3,760 | $338,036 | $62,157 | $275,879 |
| 2022 | $3,606 | $331,409 | $60,939 | $270,470 |
| 2021 | $3,521 | $324,911 | $59,744 | $265,167 |
| 2020 | $3,457 | $321,579 | $59,131 | $262,448 |
| 2019 | $3,454 | $315,274 | $57,972 | $257,302 |
| 2018 | $3,304 | $309,092 | $56,835 | $252,257 |
| 2017 | $3,251 | $303,032 | $55,721 | $247,311 |
| 2016 | $3,006 | $288,000 | $72,000 | $216,000 |
| 2015 | $2,670 | $283,000 | $71,000 | $212,000 |
| 2014 | $2,670 | $255,000 | $64,000 | $191,000 |
Source: Public Records
Map
Nearby Homes
- 2300 W Morton Ave Unit 163
- 2300 W Morton Ave Unit 22
- 2300 W Morton Ave Unit 135
- 575 N Brandy Way
- 15247 Road 223
- 2070 W Harrison Ave
- 313 Balmoral Dr
- 2179 W Della Ave
- 100 S Westwood St Unit 52
- 100 S Westwood St Unit 1
- 100 S Westwood St Unit 17
- 100 S Westwood St
- 100 S Westwood St Unit Lot 105
- 100 S Westwood St Unit 110
- 100 S Westwood St Unit Lot 71
- 100 S Westwood St Unit 128
- 100 S Westwood St Unit 92
- 100 S Westwood St Unit 20
- Sydney Plan at Laurelwood
- Carlton Plan at Laurelwood
- 421 N Jennifer Way
- 436 N Ryan Terrace
- 441 N Jennifer Way
- 426 N Ryan Terrace
- 446 N Ryan Terrace
- 451 N Jennifer Way
- 404 N Jennifer Way
- 22344 W Harrison Ave
- 22356 W Harrison Ave
- 456 N Ryan Terrace
- 22332 W Harrison Ave
- 434 N Jennifer Way
- 391 N Westwood St
- 424 N Jennifer Way
- 461 N Jennifer Way
- 403 N Ryan Terrace
- 444 N Jennifer Way
- 466 N Ryan Terrace
- 413 N Ryan Terrace
- 423 N Ryan Terrace