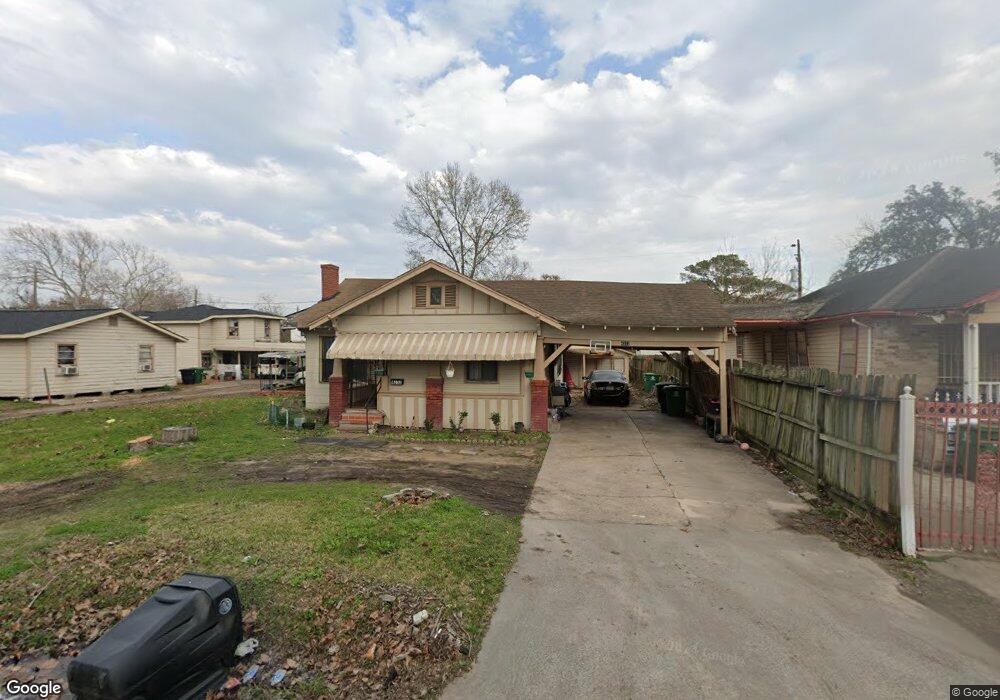
4312 Siegel St Houston, TX 77009
Northside Village NeighborhoodEstimated Value: $538,000 - $605,949
3
Beds
3
Baths
2,911
Sq Ft
$197/Sq Ft
Est. Value
About This Home
This home is located at 4312 Siegel St, Houston, TX 77009 and is currently estimated at $574,737, approximately $197 per square foot. 4312 Siegel St is a home located in Harris County with nearby schools including Jefferson Elementary School, Marshall Middle, and Northside High School.
Ownership History
Date
Name
Owned For
Owner Type
Purchase Details
Closed on
Nov 20, 1998
Sold by
Pulte Homes Of Texas Lp
Bought by
Lundy Marshall S and Lundy Sonya Scott
Current Estimated Value
Home Financials for this Owner
Home Financials are based on the most recent Mortgage that was taken out on this home.
Original Mortgage
$81,308
Outstanding Balance
$17,545
Interest Rate
6.46%
Mortgage Type
FHA
Estimated Equity
$557,192
Create a Home Valuation Report for This Property
The Home Valuation Report is an in-depth analysis detailing your home's value as well as a comparison with similar homes in the area
Home Values in the Area
Average Home Value in this Area
Purchase History
| Date | Buyer | Sale Price | Title Company |
|---|---|---|---|
| Lundy Marshall S | -- | Alamo Title 32 |
Source: Public Records
Mortgage History
| Date | Status | Borrower | Loan Amount |
|---|---|---|---|
| Open | Lundy Marshall S | $81,308 |
Source: Public Records
Tax History Compared to Growth
Tax History
| Year | Tax Paid | Tax Assessment Tax Assessment Total Assessment is a certain percentage of the fair market value that is determined by local assessors to be the total taxable value of land and additions on the property. | Land | Improvement |
|---|---|---|---|---|
| 2025 | $12,486 | $583,267 | $423,500 | $159,767 |
| 2024 | $12,486 | $596,722 | $431,750 | $164,972 |
| 2023 | $12,486 | $578,381 | $431,750 | $146,631 |
| 2022 | $10,892 | $494,685 | $346,500 | $148,185 |
| 2021 | $9,066 | $389,000 | $231,000 | $158,000 |
| 2020 | $9,167 | $378,559 | $231,000 | $147,559 |
| 2019 | $9,742 | $385,000 | $220,000 | $165,000 |
| 2018 | $6,959 | $275,000 | $167,750 | $107,250 |
| 2017 | $6,954 | $275,000 | $167,750 | $107,250 |
| 2016 | $8,145 | $322,123 | $154,000 | $168,123 |
| 2015 | $5,459 | $280,883 | $110,000 | $170,883 |
| 2014 | $5,459 | $212,360 | $49,500 | $162,860 |
Source: Public Records
Map
Nearby Homes