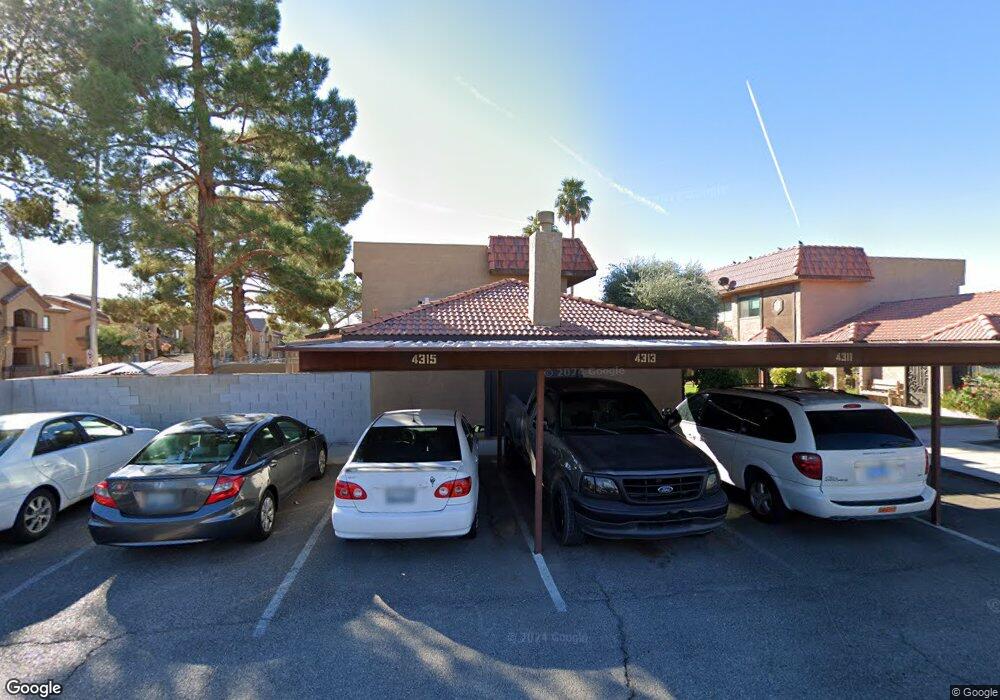
4315 Maneilly Dr Las Vegas, NV 89110
East Las Vegas NeighborhoodEstimated Value: $146,481 - $171,000
2
Beds
1
Bath
750
Sq Ft
$210/Sq Ft
Est. Value
About This Home
This home is located at 4315 Maneilly Dr, Las Vegas, NV 89110 and is currently estimated at $157,494, approximately $209 per square foot. 4315 Maneilly Dr is a home located in Clark County with nearby schools including Ruben P. Diaz Elementary School, Mario C. & Joanne Monaco Middle School, and Desert Pines High School.
Ownership History
Date
Name
Owned For
Owner Type
Purchase Details
Closed on
Dec 20, 2013
Sold by
County Of Carlk
Bought by
Kapon Daniel
Current Estimated Value
Purchase Details
Closed on
Jun 9, 2012
Sold by
Vegas Green Townhouses
Bought by
Treasurer Of Clark County
Purchase Details
Closed on
Oct 14, 2011
Sold by
Nevada Association Services Inc
Bought by
Vegas Green Townhouses
Purchase Details
Closed on
Feb 21, 2006
Sold by
Zamora Silverio
Bought by
Zamora Silverio and Zamora Alicia
Home Financials for this Owner
Home Financials are based on the most recent Mortgage that was taken out on this home.
Original Mortgage
$88,000
Interest Rate
9.75%
Mortgage Type
Unknown
Purchase Details
Closed on
May 12, 2005
Sold by
Vasquez Carlos H
Bought by
Zamora Silverio
Purchase Details
Closed on
Jan 2, 2002
Sold by
Zachman Edward Joseph
Bought by
Vasquez Carlos H
Home Financials for this Owner
Home Financials are based on the most recent Mortgage that was taken out on this home.
Original Mortgage
$56,020
Interest Rate
7.11%
Mortgage Type
FHA
Create a Home Valuation Report for This Property
The Home Valuation Report is an in-depth analysis detailing your home's value as well as a comparison with similar homes in the area
Home Values in the Area
Average Home Value in this Area
Purchase History
| Date | Buyer | Sale Price | Title Company |
|---|---|---|---|
| Kapon Daniel | $27,500 | None Available | |
| Treasurer Of Clark County | -- | None Available | |
| Vegas Green Townhouses | $8,074 | North American Title Sunset | |
| Zamora Silverio | -- | National Alliance Title | |
| Zamora Silverio | $56,900 | -- | |
| Vasquez Carlos H | $56,900 | Stewart Title |
Source: Public Records
Mortgage History
| Date | Status | Borrower | Loan Amount |
|---|---|---|---|
| Previous Owner | Zamora Silverio | $88,000 | |
| Previous Owner | Vasquez Carlos H | $56,020 |
Source: Public Records
Tax History Compared to Growth
Tax History
| Year | Tax Paid | Tax Assessment Tax Assessment Total Assessment is a certain percentage of the fair market value that is determined by local assessors to be the total taxable value of land and additions on the property. | Land | Improvement |
|---|---|---|---|---|
| 2025 | $751 | $25,731 | $9,100 | $16,631 |
| 2024 | $844 | $25,731 | $9,100 | $16,631 |
| 2023 | $844 | $29,444 | $13,650 | $15,794 |
| 2022 | $295 | $25,654 | $10,500 | $15,154 |
| 2021 | $805 | $22,871 | $10,150 | $12,721 |
| 2020 | $251 | $23,571 | $10,150 | $13,421 |
| 2019 | $235 | $20,460 | $7,000 | $13,460 |
| 2018 | $224 | $17,580 | $4,550 | $13,030 |
| 2017 | $581 | $17,422 | $4,550 | $12,872 |
| 2016 | $212 | $14,204 | $3,500 | $10,704 |
| 2015 | $210 | $12,506 | $3,500 | $9,006 |
| 2014 | $203 | $10,965 | $2,800 | $8,165 |
Source: Public Records
Map
Nearby Homes
- 4254 Lunar Lullaby Ave
- 4272 Lunar Lullaby Ave
- 4260 Lunar Lullaby Ave
- 4278 Lunar Lullaby Ave
- 4266 Lunar Lullaby Ave
- Drumlin Plan at Parkhill Crest
- Heywood Plan at Parkhill Crest
- Arroway Plan at Parkhill Crest
- 1560 Jamielinn Ln Unit 101
- 1570 Jamielinn Ln Unit 104
- 1500 Jamielinn Ln Unit 201
- 1618 Meno Peak St
- 4132 Mark Twain Ct
- 11 Bon Rea Cir
- 4438 E Van Buren Ave
- 1400 Jamielinn Ln Unit 102
- 26 Arcade Cir
- 1421 Henry Dr
- 4244 Middlesex Ave
- 4363 Pittsfield St
- 4313 Maneilly Dr
- 4311 Maneilly Dr
- 4309 Maneilly Dr
- 4301 Maneilly Dr
- 4303 Maneilly Dr
- 4305 Maneilly Dr
- 4308 Lynnann Dr
- 4314 Maneilly Dr
- 4307 Maneilly Dr
- 4312 Maneilly Dr
- 4306 Lynnann Dr
- 4300 Maneilly Dr
- 4312 Lynnann Dr
- 4310 Maneilly Dr
- 4310 Maneilly Dr Unit n/a
- 4302 Maneilly Dr
- 4308 Maneilly Dr
- 4314 Lynnann Dr
- 4302 Lynnann Dr
- 4304 Maneilly Dr