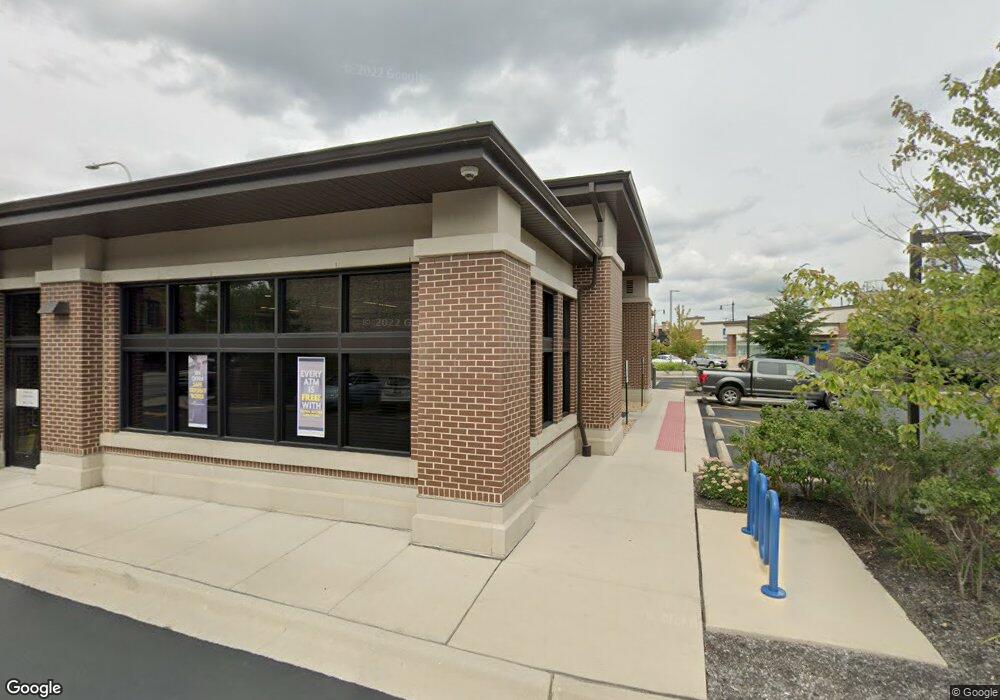
4319 N Elston Ave Chicago, IL 60641
Irving Park NeighborhoodEstimated Value: $555,293
--
Bed
--
Bath
1,200
Sq Ft
$463/Sq Ft
Est. Value
About This Home
This home is located at 4319 N Elston Ave, Chicago, IL 60641 and is currently priced at $555,293, approximately $462 per square foot. 4319 N Elston Ave is a home located in Cook County with nearby schools including Haugan Elementary School, Roosevelt High School, and Gateway Montessori School.
Ownership History
Date
Name
Owned For
Owner Type
Purchase Details
Closed on
Jun 17, 2014
Sold by
Northbrook Bank & Trust Company
Bought by
North Shore Community Bank & Trust Co
Current Estimated Value
Purchase Details
Closed on
Aug 4, 2005
Sold by
Albany Bank & Trust Co Na
Bought by
Labe Bank
Purchase Details
Closed on
Jul 2, 2001
Sold by
Rachelski Stacie
Bought by
Albany Bank & Trust Company Na and Trust #11-5770
Purchase Details
Closed on
Dec 28, 2000
Sold by
Lasalle Bank National Assn
Bought by
Bachelski Stacie
Purchase Details
Closed on
May 23, 1997
Sold by
Palladinetti Carl P
Bought by
Gladstone Norwood Trust & Svgs Bank and Trust #1947
Purchase Details
Closed on
Jan 31, 1996
Sold by
American National Bk & Tr Co Of Chicago
Bought by
Palladinetti Carl P
Home Financials for this Owner
Home Financials are based on the most recent Mortgage that was taken out on this home.
Original Mortgage
$227,500
Interest Rate
7.46%
Mortgage Type
Commercial
Create a Home Valuation Report for This Property
The Home Valuation Report is an in-depth analysis detailing your home's value as well as a comparison with similar homes in the area
Home Values in the Area
Average Home Value in this Area
Purchase History
| Date | Buyer | Sale Price | Title Company |
|---|---|---|---|
| North Shore Community Bank & Trust Co | $2,729,500 | None Available | |
| Labe Bank | $370,000 | Ctic | |
| Albany Bank & Trust Company Na | $350,000 | -- | |
| Bachelski Stacie | $350,000 | -- | |
| Gladstone Norwood Trust & Svgs Bank | -- | -- | |
| Palladinetti Carl P | -- | Attorneys Natl Title Network |
Source: Public Records
Mortgage History
| Date | Status | Borrower | Loan Amount |
|---|---|---|---|
| Previous Owner | Palladinetti Carl P | $227,500 |
Source: Public Records
Tax History Compared to Growth
Tax History
| Year | Tax Paid | Tax Assessment Tax Assessment Total Assessment is a certain percentage of the fair market value that is determined by local assessors to be the total taxable value of land and additions on the property. | Land | Improvement |
|---|---|---|---|---|
| 2024 | $3,548 | $28,591 | $27,344 | $1,247 |
| 2023 | $3,457 | $15,681 | $14,063 | $1,618 |
| 2022 | $3,457 | $15,681 | $14,063 | $1,618 |
| 2021 | $3,376 | $15,679 | $14,062 | $1,617 |
| 2020 | $3,541 | $15,839 | $14,062 | $1,777 |
| 2019 | $3,193 | $15,839 | $14,062 | $1,777 |
| 2018 | $3,139 | $15,839 | $14,062 | $1,777 |
| 2017 | $2,881 | $13,339 | $12,304 | $1,035 |
| 2016 | $2,681 | $13,339 | $12,304 | $1,035 |
| 2015 | $2,453 | $13,339 | $12,304 | $1,035 |
| 2014 | $916 | $4,921 | $4,921 | $0 |
| 2013 | $898 | $4,921 | $4,921 | $0 |
Source: Public Records
Map
Nearby Homes
- 4243 N Keystone Ave Unit GN
- 4239 N Keystone Ave Unit 3S
- 4387 N Elston Ave
- 4101 W Montrose Ave
- 4337 N Kedvale Ave Unit 206
- 4337 N Kedvale Ave Unit 2E
- 3816 W Montrose Ave
- 4461 N Pulaski Rd
- 4342 N Kedvale Ave Unit 2A
- 4106 N Avers Ave
- 4110 N Keystone Ave Unit 1N
- 4146 N Kedvale Ave Unit 1C
- 4515 N Karlov Ave
- 3707 W Cullom Ave Unit 1
- 4304 N Lawndale Ave
- 4533 N Karlov Ave
- 4515 N Hamlin Ave
- 4115 N Ridgeway Ave
- 4545 N Kedvale Ave
- 4602 N Springfield Ave
- 4323 N Elston Ave
- 4323 N Elston Ave
- 4315 N Elston Ave
- 4316 N Harding Ave
- 4317 N Elston Ave Unit 2
- 4332 N Elston Ave
- 4318 N Elston Ave
- 4320 N Harding Ave
- 4322 N Elston Ave
- 4322 N Elston Ave Unit 2
- 4322 N Elston Ave Unit 2B
- 3914 W Cullom Ave Unit 24
- 4314 N Elston Ave
- 4309 N Harding Ave
- 4311 N Harding Ave
- 4326 N Elston Ave Unit B
- 4326 N Elston Ave Unit C
- 4326 N Elston Ave
- 4326 N Elston Ave Unit D
- 4324 N Harding Ave