432-434 Wilson Ave Unit 2 Columbus, OH 43205
South of Main NeighborhoodEstimated Value: $292,182 - $439,000
6
Beds
2
Baths
2,880
Sq Ft
$124/Sq Ft
Est. Value
About This Home
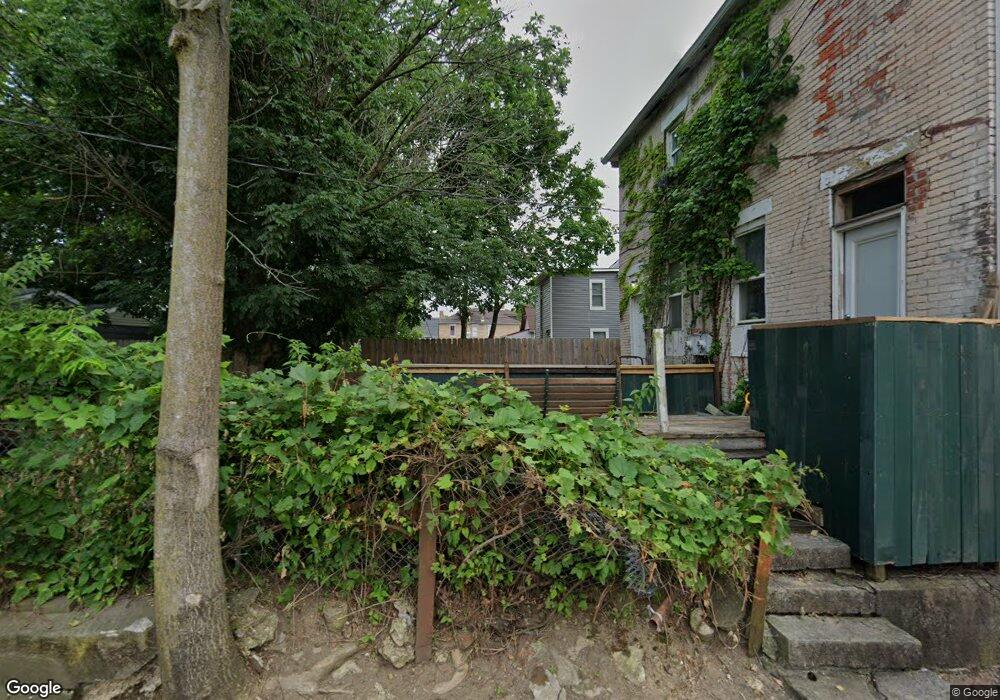
This home is located at 432-434 Wilson Ave Unit 2, Columbus, OH 43205 and is currently estimated at $356,046, approximately $123 per square foot. 432-434 Wilson Ave Unit 2 is a home located in Franklin County with nearby schools including Ohio Avenue Elementary School, Champion Middle School, and East High School.
Ownership History
Date
Name
Owned For
Owner Type
Purchase Details
Closed on
Mar 13, 2017
Sold by
Hibbs G Shane and Woods Cove Iii Llc
Bought by
Asculus Properties Llc
Current Estimated Value
Purchase Details
Closed on
Mar 30, 2005
Sold by
The Bank Of New York
Bought by
Hibbs G Shane
Purchase Details
Closed on
Feb 9, 2005
Sold by
Hazel Nadine Y and Abn Amro Mortgage Group Inc
Bought by
Bank Of New York and Eqcc Trust
Purchase Details
Closed on
Nov 28, 2000
Sold by
Hazel Nadine Y
Bought by
Starnes William
Home Financials for this Owner
Home Financials are based on the most recent Mortgage that was taken out on this home.
Original Mortgage
$61,273
Interest Rate
11.05%
Purchase Details
Closed on
May 4, 1994
Bought by
Hazel Nadine Y
Purchase Details
Closed on
Mar 8, 1993
Purchase Details
Closed on
Jun 2, 1992
Create a Home Valuation Report for This Property
The Home Valuation Report is an in-depth analysis detailing your home's value as well as a comparison with similar homes in the area
Home Values in the Area
Average Home Value in this Area
Purchase History
| Date | Buyer | Sale Price | Title Company |
|---|---|---|---|
| Asculus Properties Llc | -- | None Available | |
| Hibbs G Shane | $31,900 | Sovereign | |
| Bank Of New York | $52,000 | -- | |
| Starnes William | $92,000 | -- | |
| Hazel Nadine Y | $50,100 | -- | |
| -- | -- | -- | |
| -- | $7,100 | -- |
Source: Public Records
Mortgage History
| Date | Status | Borrower | Loan Amount |
|---|---|---|---|
| Previous Owner | Starnes William | $61,273 |
Source: Public Records
Tax History Compared to Growth
Tax History
| Year | Tax Paid | Tax Assessment Tax Assessment Total Assessment is a certain percentage of the fair market value that is determined by local assessors to be the total taxable value of land and additions on the property. | Land | Improvement |
|---|---|---|---|---|
| 2024 | $3,301 | $72,030 | $21,140 | $50,890 |
| 2023 | $3,260 | $72,030 | $21,140 | $50,890 |
| 2022 | $1,219 | $22,930 | $1,650 | $21,280 |
| 2021 | $1,329 | $22,930 | $1,650 | $21,280 |
| 2020 | $1,223 | $22,930 | $1,650 | $21,280 |
| 2019 | $1,189 | $19,120 | $1,370 | $17,750 |
| 2018 | $1,165 | $19,120 | $1,370 | $17,750 |
| 2017 | $925 | $19,120 | $1,370 | $17,750 |
| 2016 | $1,161 | $17,090 | $2,840 | $14,250 |
| 2015 | $1,057 | $17,090 | $2,840 | $14,250 |
| 2014 | $1,060 | $17,090 | $2,840 | $14,250 |
| 2013 | $549 | $17,955 | $2,975 | $14,980 |
Source: Public Records
Map
Nearby Homes
- 374 Wilson Ave Unit 374-76
- 532 Linwood Ave Unit 34
- 532-534 Linwood Ave
- 1140 E Mound St
- 0 E Fulton St
- 555 Kimball Place Unit 557
- 347 Kendall Place
- 572 Linwood Ave
- 1179 E Rich St
- 436-438 S Champion Ave
- 1119 E Fulton St
- 1345 E Fulton St
- 939 E Rich St
- 1469 E Rich St
- 568-570 Kimball Place
- 1364 E Fulton St Unit 366
- 1174 E Rich St Unit 1172-1174
- 511 S Champion Ave
- 0 Mooberry St
- 509 S Champion Ave Unit 511
- 432 Wilson Ave Unit 434
- 432-434 Wilson Ave
- 436 Wilson Ave
- 434 Wilson Ave
- 440 Wilson Ave Unit 442
- 440 Wilson Ave Unit 2
- 440 Wilson Ave Unit 1
- 426 Wilson Ave
- 444 Wilson Ave
- 422 Wilson Ave
- 1236 E Mound St
- 1247 Mcallister Ave
- 1220 E Mound St
- 1245 E Main St
- 448 Wilson Ave Unit 450
- 1251 Mcallister Ave
- 1229 E Main St
- 1251 E Main St
- 1251 E Main St Unit F
- 1238 E Mound St Unit 242