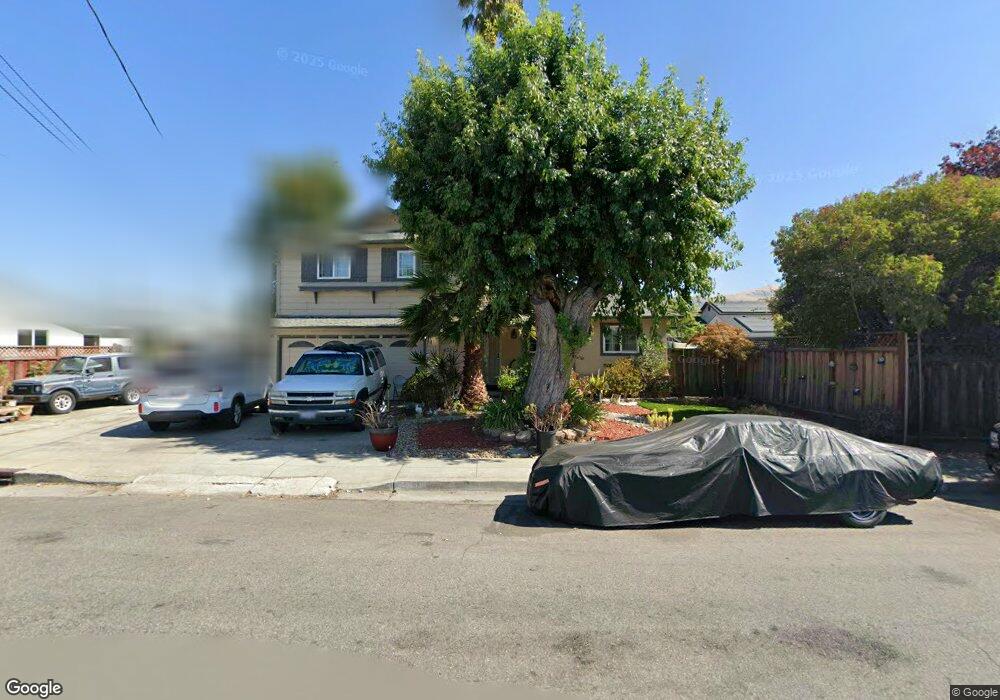
43218 Gatewood St Fremont, CA 94538
Grimmer NeighborhoodEstimated Value: $1,425,000 - $1,621,000
4
Beds
3
Baths
1,485
Sq Ft
$1,008/Sq Ft
Est. Value
About This Home
This home is located at 43218 Gatewood St, Fremont, CA 94538 and is currently estimated at $1,497,174, approximately $1,008 per square foot. 43218 Gatewood St is a home located in Alameda County with nearby schools including Harvey Green Elementary School, John M. Horner Junior High School, and Irvington High School.
Ownership History
Date
Name
Owned For
Owner Type
Purchase Details
Closed on
Jun 22, 2021
Sold by
Shah Pratibha Manharlal
Bought by
Shah Manharlal Manilal
Current Estimated Value
Purchase Details
Closed on
Jun 16, 2008
Sold by
Shah Manharlal M and Shah Pratibha M
Bought by
Shah Manharlal M and Shah Pratibha M
Purchase Details
Closed on
Feb 24, 1997
Sold by
Dueck Lorin C and Dueck Terry L
Bought by
Shah Manharial M and Shah Pratibha M
Home Financials for this Owner
Home Financials are based on the most recent Mortgage that was taken out on this home.
Original Mortgage
$164,000
Interest Rate
5.5%
Purchase Details
Closed on
Oct 7, 1996
Sold by
Kobe Amy
Bought by
Kobe Allen
Create a Home Valuation Report for This Property
The Home Valuation Report is an in-depth analysis detailing your home's value as well as a comparison with similar homes in the area
Home Values in the Area
Average Home Value in this Area
Purchase History
| Date | Buyer | Sale Price | Title Company |
|---|---|---|---|
| Shah Manharlal Manilal | -- | -- | |
| Shah Manharlal M | -- | None Available | |
| Shah Manharlal M | -- | None Available | |
| Shah Manharial M | $205,000 | Commonwealth Land Title Co | |
| Kobe Allen | -- | American Title Co |
Source: Public Records
Mortgage History
| Date | Status | Borrower | Loan Amount |
|---|---|---|---|
| Previous Owner | Shah Manharial M | $164,000 |
Source: Public Records
Tax History Compared to Growth
Tax History
| Year | Tax Paid | Tax Assessment Tax Assessment Total Assessment is a certain percentage of the fair market value that is determined by local assessors to be the total taxable value of land and additions on the property. | Land | Improvement |
|---|---|---|---|---|
| 2025 | $4,614 | $340,970 | $100,158 | $240,812 |
| 2024 | $4,614 | $334,285 | $98,194 | $236,091 |
| 2023 | $4,477 | $327,732 | $96,269 | $231,463 |
| 2022 | $4,401 | $321,307 | $94,382 | $226,925 |
| 2021 | $4,225 | $308,438 | $92,531 | $215,907 |
| 2020 | $4,173 | $305,277 | $91,583 | $213,694 |
| 2019 | $4,130 | $299,293 | $89,788 | $209,505 |
| 2018 | $4,047 | $293,426 | $88,028 | $205,398 |
| 2017 | $3,948 | $287,674 | $86,302 | $201,372 |
| 2016 | $3,871 | $282,034 | $84,610 | $197,424 |
| 2015 | $3,811 | $277,798 | $83,339 | $194,459 |
| 2014 | $3,739 | $272,358 | $81,707 | $190,651 |
Source: Public Records
Map
Nearby Homes
- 262 Manitoba Green
- 202 Manitoba Terrace
- 261 Manitoba Green Unit 261
- 42932 Peachwood St
- 257 Manitoba Green
- 208 Manitoba Terrace
- 92 Delta Green
- 4309 Bora Ave
- 48 Eagle Green
- 42759 Newport Dr
- 43163 Grimmer Terrace
- 41882 Gifford St
- 4533 Capewood Terrace
- 4537 Capewood Terrace
- 3872 Wildflower Common Unit 27
- 4860 Bryce Canyon Park Dr
- 3631 Haven Ave
- 3918 Fossano Common
- 3800 Adams Ave
- 3493 Router Common
- 4197 Converse St
- 4180 Crestwood St
- 4193 Converse St
- 43210 Gatewood St
- 4174 Crestwood St
- 4189 Converse St
- 4168 Crestwood St
- 4183 Converse St
- 43229 Gatewood St
- 43219 Gatewood St
- 4162 Crestwood St
- 43237 Gatewood St
- 43211 Gatewood St
- 43334 Gatewood St
- 4175 Converse St
- 43315 Gatewood St
- 4156 Crestwood St
- 4181 Crestwood St
- 4175 Crestwood St
- 43202 Gatewood St