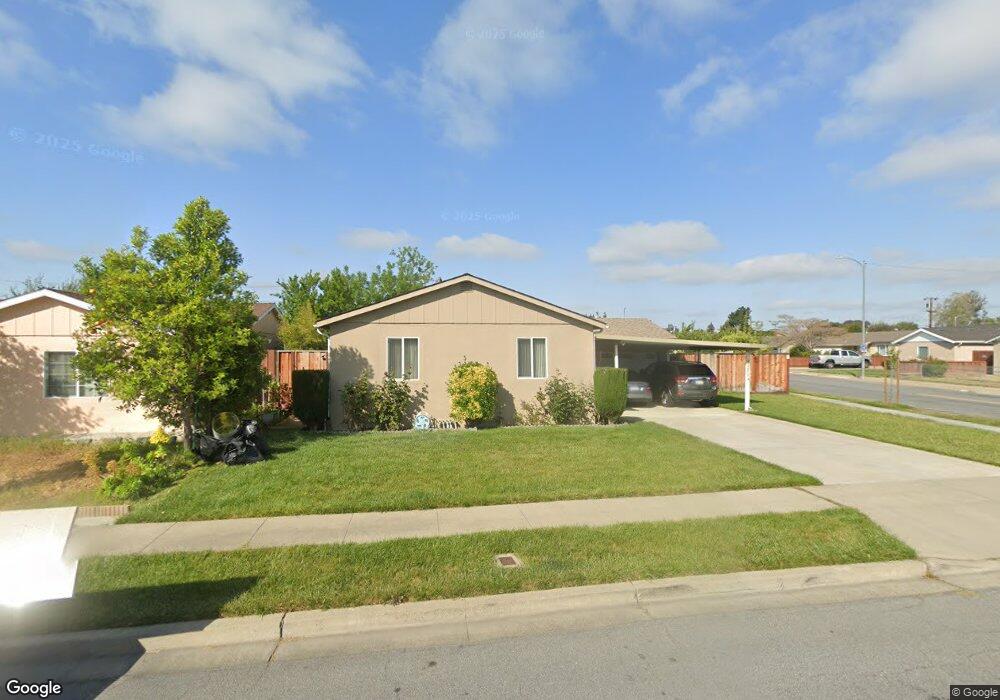
43275 Cedarwood Dr Fremont, CA 94538
Grimmer NeighborhoodEstimated Value: $1,246,000 - $1,679,000
4
Beds
2
Baths
1,136
Sq Ft
$1,224/Sq Ft
Est. Value
About This Home
This home is located at 43275 Cedarwood Dr, Fremont, CA 94538 and is currently estimated at $1,390,945, approximately $1,224 per square foot. 43275 Cedarwood Dr is a home located in Alameda County with nearby schools including Harvey Green Elementary School, John M. Horner Junior High School, and Irvington High School.
Ownership History
Date
Name
Owned For
Owner Type
Purchase Details
Closed on
Jul 2, 2024
Sold by
Argonza Franklin C and Argonza Jean D
Bought by
Argonza Family Trust and Argonza
Current Estimated Value
Purchase Details
Closed on
Aug 1, 2021
Sold by
Argonza Franklin C
Bought by
Argonza Franklin C and Argonza Jean D
Purchase Details
Closed on
May 1, 2021
Sold by
Abad Ferdinand B
Bought by
Abed Donna Z
Purchase Details
Closed on
Apr 26, 2021
Sold by
Argonza Franklin C
Bought by
Argonza Franklin C
Purchase Details
Closed on
Nov 2, 2002
Sold by
Argonza Franklin C and Argonza Jean Dasilao
Bought by
Argonza Franklin C
Home Financials for this Owner
Home Financials are based on the most recent Mortgage that was taken out on this home.
Original Mortgage
$114,600
Interest Rate
5.88%
Create a Home Valuation Report for This Property
The Home Valuation Report is an in-depth analysis detailing your home's value as well as a comparison with similar homes in the area
Home Values in the Area
Average Home Value in this Area
Purchase History
| Date | Buyer | Sale Price | Title Company |
|---|---|---|---|
| Argonza Family Trust | -- | None Listed On Document | |
| Argonza Franklin C | -- | None Available | |
| Abed Donna Z | -- | None Available | |
| Argonza Franklin C | -- | None Available | |
| Argonza Franklin C | -- | Chicago Title Co |
Source: Public Records
Mortgage History
| Date | Status | Borrower | Loan Amount |
|---|---|---|---|
| Previous Owner | Argonza Franklin C | $114,600 |
Source: Public Records
Tax History Compared to Growth
Tax History
| Year | Tax Paid | Tax Assessment Tax Assessment Total Assessment is a certain percentage of the fair market value that is determined by local assessors to be the total taxable value of land and additions on the property. | Land | Improvement |
|---|---|---|---|---|
| 2025 | $4,232 | $306,777 | $94,133 | $219,644 |
| 2024 | $4,232 | $300,625 | $92,287 | $215,338 |
| 2023 | $4,104 | $301,594 | $90,478 | $211,116 |
| 2022 | $4,029 | $288,681 | $88,704 | $206,977 |
| 2021 | $3,935 | $282,883 | $86,965 | $202,918 |
| 2020 | $3,879 | $286,911 | $86,073 | $200,838 |
| 2019 | $3,837 | $281,286 | $84,386 | $196,900 |
| 2018 | $3,759 | $275,771 | $82,731 | $193,040 |
| 2017 | $3,665 | $270,364 | $81,109 | $189,255 |
| 2016 | $3,591 | $265,064 | $79,519 | $185,545 |
| 2015 | $3,532 | $261,084 | $78,325 | $182,759 |
| 2014 | $3,463 | $255,971 | $76,791 | $179,180 |
Source: Public Records
Map
Nearby Homes
- 92 Delta Green
- 43163 Grimmer Terrace
- 42932 Peachwood St
- 48 Eagle Green
- 262 Manitoba Green
- 202 Manitoba Terrace
- 208 Manitoba Terrace
- 257 Manitoba Green
- 4309 Bora Ave
- 4533 Capewood Terrace
- 4537 Capewood Terrace
- 4860 Bryce Canyon Park Dr
- 41882 Gifford St
- 42759 Newport Dr
- 3872 Wildflower Common Unit 27
- 5341 Audubon Park Ct
- 4751 Wadsworth Ct
- 40696 Robin St
- 5560 Boscell Common
- 3918 Fossano Common
- 43283 Cedarwood Dr
- 43274 Arkwood St
- 43282 Arkwood St
- 43291 Cedarwood Dr
- 43225 Arkwood St
- 43290 Arkwood St
- 4475 Bush Cir
- 43233 Arkwood St
- 4472 Bush Cir
- 43299 Cedarwood Dr
- 43298 Arkwood St
- 43241 Arkwood St
- 43260 Cedarwood Dr
- 4471 Bush Cir
- 4470 Bush Cir
- 43305 Cedarwood Dr
- 4502 Crestwood St
- 43273 Arkwood St
- 43304 Arkwood St
- 43281 Arkwood St