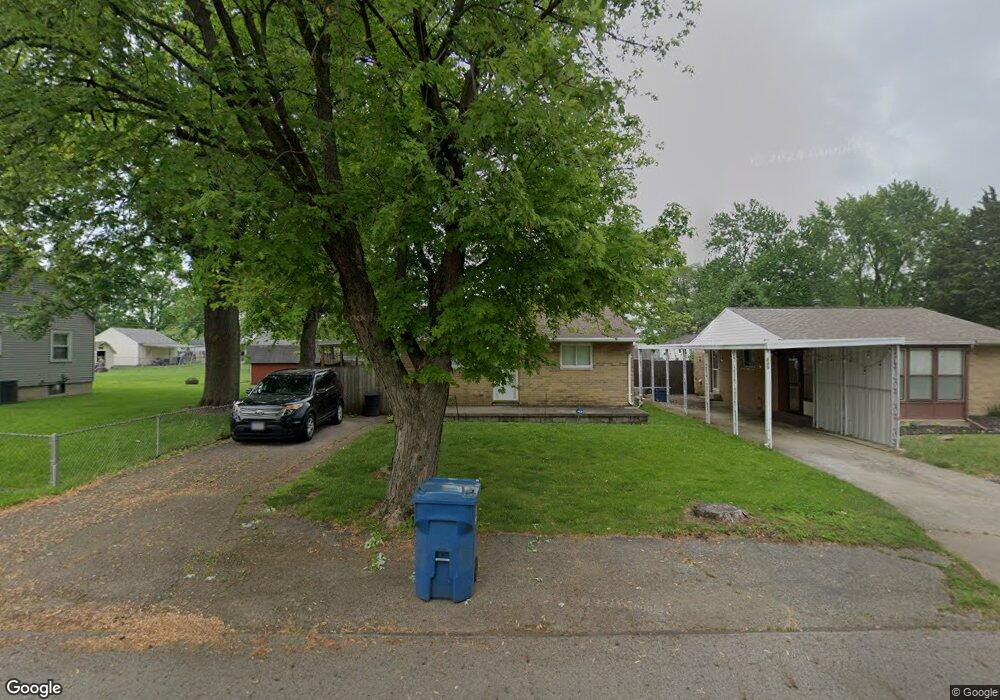
434 Elverne Ave Dayton, OH 45404
Avondale NeighborhoodEstimated Value: $72,374 - $134,000
2
Beds
1
Bath
756
Sq Ft
$128/Sq Ft
Est. Value
About This Home
This home is located at 434 Elverne Ave, Dayton, OH 45404 and is currently estimated at $96,844, approximately $128 per square foot. 434 Elverne Ave is a home located in Montgomery County with nearby schools including Stebbins High School, Pathway School of Discovery, and Our Lady of the Rosary School.
Ownership History
Date
Name
Owned For
Owner Type
Purchase Details
Closed on
Nov 20, 2007
Sold by
Caudill Vanessa L
Bought by
Nationstar Mortgage Llc and Centex Hone Equity Llc
Current Estimated Value
Home Financials for this Owner
Home Financials are based on the most recent Mortgage that was taken out on this home.
Original Mortgage
$56,778
Outstanding Balance
$35,794
Interest Rate
6.31%
Mortgage Type
Purchase Money Mortgage
Estimated Equity
$61,050
Purchase Details
Closed on
Sep 10, 2007
Sold by
Nationstar Mortgage Llc
Bought by
Cole Christopher J
Home Financials for this Owner
Home Financials are based on the most recent Mortgage that was taken out on this home.
Original Mortgage
$56,778
Interest Rate
6.31%
Mortgage Type
Purchase Money Mortgage
Purchase Details
Closed on
Feb 18, 1994
Sold by
Caudill Russell and Caudill Margie
Bought by
Caudill Russell
Create a Home Valuation Report for This Property
The Home Valuation Report is an in-depth analysis detailing your home's value as well as a comparison with similar homes in the area
Home Values in the Area
Average Home Value in this Area
Purchase History
| Date | Buyer | Sale Price | Title Company |
|---|---|---|---|
| Nationstar Mortgage Llc | $44,000 | None Available | |
| Cole Christopher J | $39,000 | Resource Title Of Cincinnati | |
| Caudill Russell | -- | -- |
Source: Public Records
Mortgage History
| Date | Status | Borrower | Loan Amount |
|---|---|---|---|
| Open | Nationstar Mortgage Llc | $56,778 | |
| Previous Owner | Cole Christopher J | $56,778 |
Source: Public Records
Tax History Compared to Growth
Tax History
| Year | Tax Paid | Tax Assessment Tax Assessment Total Assessment is a certain percentage of the fair market value that is determined by local assessors to be the total taxable value of land and additions on the property. | Land | Improvement |
|---|---|---|---|---|
| 2024 | $926 | $19,230 | $4,250 | $14,980 |
| 2023 | $926 | $19,230 | $4,250 | $14,980 |
| 2022 | $988 | $15,380 | $3,400 | $11,980 |
| 2021 | $1,007 | $15,380 | $3,400 | $11,980 |
| 2020 | $1,007 | $15,380 | $3,400 | $11,980 |
| 2019 | $1,097 | $14,970 | $3,060 | $11,910 |
| 2018 | $1,099 | $14,970 | $3,060 | $11,910 |
| 2017 | $1,098 | $14,970 | $3,060 | $11,910 |
| 2016 | $1,082 | $14,300 | $3,400 | $10,900 |
| 2015 | $1,220 | $14,300 | $3,400 | $10,900 |
| 2014 | $1,220 | $14,300 | $3,400 | $10,900 |
| 2012 | -- | $15,870 | $3,390 | $12,480 |
Source: Public Records
Map
Nearby Homes
- 3535 Golden Meadows Ct
- 3586 Lane Garden Ct
- 620 Homecrest Ave
- 634 Mentor Ave
- 1930 Brandt Pike
- 512 Reading Rd
- 508 Reading Rd
- 2460 Bushnell Ave
- 546 Wynora Ave
- 518 Tyron Ave
- 535 Reading Rd
- -- Valley Pike
- - Valley Pike
- 2249 - Valley Pike
- 2301 Valley Pike
- 241 Community Dr
- 641 Prince Albert Blvd
- - Prince Albert Blvd
- -- Prince Albert Blvd
- 2512 Harshman Rd
- 442 Elverne Ave
- 430 Elverne Ave
- 410 Elverne Ave
- 421 Marjorie Ave
- 433 Elverne Ave
- 450 Elverne Ave
- 415 Marjorie Ave
- 441 Marjorie Ave
- 441 Elverne Ave
- 407 Marjorie Ave
- 429 Elverne Ave
- 409 Marjorie Ave
- 801 Georgia Dr
- 416 Waneta Ave
- 428 Marjorie Ave
- 424 Waneta Ave
- 501 Marjorie Ave
- 436 Marjorie Ave
- 412 Waneta Ave
- 404 Elverne Ave