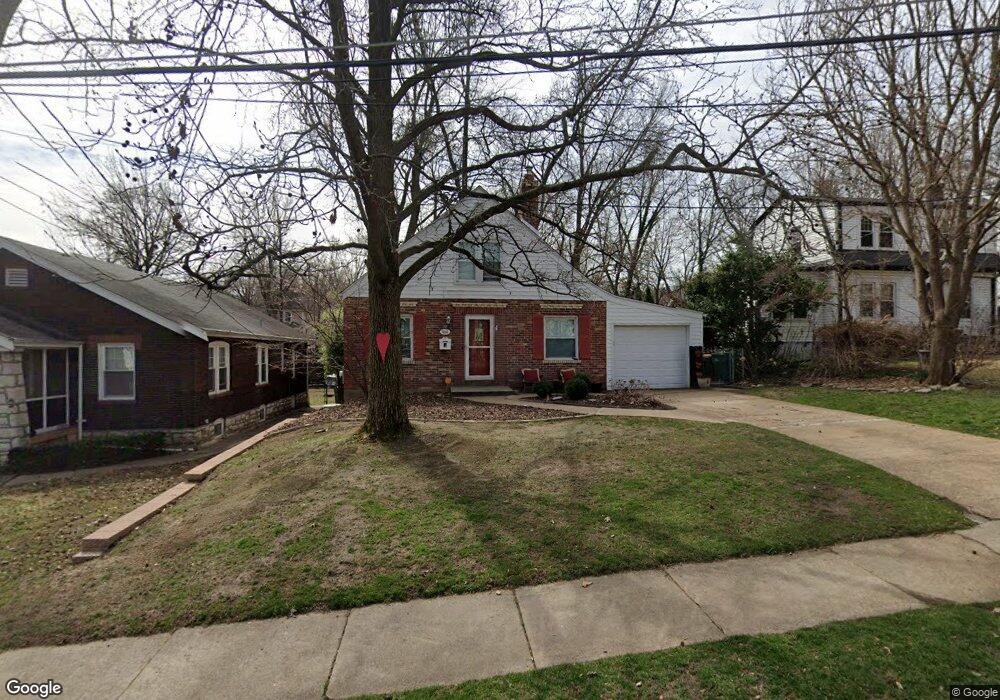
434 Greeley Ave Saint Louis, MO 63119
Estimated Value: $363,000 - $457,000
3
Beds
2
Baths
1,419
Sq Ft
$281/Sq Ft
Est. Value
About This Home
This home is located at 434 Greeley Ave, Saint Louis, MO 63119 and is currently estimated at $399,283, approximately $281 per square foot. 434 Greeley Ave is a home located in St. Louis County with nearby schools including Avery Elementary School, Hixson Middle School, and Webster Groves High School.
Ownership History
Date
Name
Owned For
Owner Type
Purchase Details
Closed on
Jun 24, 2008
Sold by
Lane Kimberly A
Bought by
Kucik Allyson and Martin Matthew S
Current Estimated Value
Home Financials for this Owner
Home Financials are based on the most recent Mortgage that was taken out on this home.
Original Mortgage
$181,772
Outstanding Balance
$116,642
Interest Rate
6.05%
Mortgage Type
FHA
Estimated Equity
$282,641
Purchase Details
Closed on
Feb 9, 2007
Sold by
Lane Kimberly A and Kiersch Kimberly
Bought by
Lane Kimberly A
Home Financials for this Owner
Home Financials are based on the most recent Mortgage that was taken out on this home.
Original Mortgage
$154,000
Interest Rate
6.13%
Mortgage Type
Stand Alone Refi Refinance Of Original Loan
Purchase Details
Closed on
Nov 10, 2004
Sold by
Kiersch Christopher
Bought by
Kiersch Kimberly
Purchase Details
Closed on
Oct 13, 2003
Sold by
Townsend Evelyn J and Tullman Sherrill Kaye
Bought by
Kiersch Kimberly Lane
Home Financials for this Owner
Home Financials are based on the most recent Mortgage that was taken out on this home.
Original Mortgage
$130,500
Interest Rate
6.37%
Mortgage Type
Purchase Money Mortgage
Create a Home Valuation Report for This Property
The Home Valuation Report is an in-depth analysis detailing your home's value as well as a comparison with similar homes in the area
Home Values in the Area
Average Home Value in this Area
Purchase History
| Date | Buyer | Sale Price | Title Company |
|---|---|---|---|
| Kucik Allyson | $184,000 | None Available | |
| Lane Kimberly A | -- | Pulaski Title Company | |
| Kiersch Kimberly | -- | -- | |
| Kiersch Kimberly Lane | $174,000 | -- |
Source: Public Records
Mortgage History
| Date | Status | Borrower | Loan Amount |
|---|---|---|---|
| Open | Kucik Allyson | $181,772 | |
| Previous Owner | Lane Kimberly A | $154,000 | |
| Previous Owner | Kiersch Kimberly Lane | $130,500 |
Source: Public Records
Tax History Compared to Growth
Tax History
| Year | Tax Paid | Tax Assessment Tax Assessment Total Assessment is a certain percentage of the fair market value that is determined by local assessors to be the total taxable value of land and additions on the property. | Land | Improvement |
|---|---|---|---|---|
| 2025 | $4,013 | $60,860 | $42,470 | $18,390 |
| 2024 | $4,013 | $57,490 | $30,890 | $26,600 |
| 2023 | $3,993 | $57,490 | $30,890 | $26,600 |
| 2022 | $4,017 | $53,710 | $30,890 | $22,820 |
| 2021 | $4,003 | $53,710 | $30,890 | $22,820 |
| 2020 | $3,855 | $48,160 | $30,890 | $17,270 |
| 2019 | $3,827 | $48,160 | $30,890 | $17,270 |
| 2018 | $3,308 | $36,900 | $21,620 | $15,280 |
| 2017 | $3,286 | $36,900 | $21,620 | $15,280 |
| 2016 | $3,432 | $36,940 | $18,530 | $18,410 |
| 2015 | $3,443 | $36,940 | $18,530 | $18,410 |
| 2014 | $3,225 | $33,650 | $13,550 | $20,100 |
Source: Public Records
Map
Nearby Homes
- 610 Cornelia Ave
- 441 Park Rd
- 619 N Bompart Ave
- 546 Holland Ave
- 112 Oakwood Ave
- 400 Marion Ave
- 814 Holland Ave
- 716 Clark Ave
- 544 Summit Ave
- 808 Greeley Ave
- 617 N Elm Ave
- 827 Cornell Ave
- 2911 Brazeau Ave
- 450 E Lockwood Ave Unit 303
- 840 Marshall Ave
- 2904 Collier Ave
- 8908 W Pendleton Ave
- 1013 Bell Ave
- 2829 Brazeau Ave
- 835 N Forest Ave
- 436 Greeley Ave
- 430 Greeley Ave
- 438 Greeley Ave
- 424 Greeley Ave
- 440 Greeley Ave
- 420 Greeley Ave
- 445 Fairview Ave
- 447 Fairview Ave
- 443 Fairview Ave
- 449 Fairview Ave
- 446 Greeley Ave
- 416 Greeley Ave
- 427 Fairview Ave
- 437 Greeley Ave
- 429 Greeley Ave
- 455 Fairview Ave
- 441 Greeley Ave
- 427 Greeley Ave
- 459 Fairview Ave
- 500 Greeley Ave