434 Wesley Chapel Rd Villa Rica, GA 30180
Estimated Value: $335,000 - $416,540
3
Beds
3
Baths
2,844
Sq Ft
$130/Sq Ft
Est. Value
About This Home
This home is located at 434 Wesley Chapel Rd, Villa Rica, GA 30180 and is currently estimated at $370,385, approximately $130 per square foot. 434 Wesley Chapel Rd is a home located in Carroll County with nearby schools including Glanton-Hindsman Elementary School, Villa Rica Middle School, and Villa Rica High School.
Ownership History
Date
Name
Owned For
Owner Type
Purchase Details
Closed on
Sep 26, 2012
Sold by
Deutsche Bank National Tru
Bought by
Arlington Investments Llc
Current Estimated Value
Purchase Details
Closed on
Jul 3, 2012
Sold by
Rosenberg Barry
Bought by
Deutsche Bank National Trust C and American Home Mtg Assets Trust
Purchase Details
Closed on
Jul 6, 2003
Sold by
Nintey Nintey Land Corp
Bought by
Rosenberg Barry Marshall and Rosenberg Patricia
Purchase Details
Closed on
Apr 1, 1998
Sold by
Bell Victoria Lelani
Bought by
Rosenberg Barry
Purchase Details
Closed on
May 8, 1997
Sold by
Suncraft Homes Inc
Bought by
Bell Victoria Lelani
Purchase Details
Closed on
Nov 1, 1994
Sold by
Suncraft Homes
Bought by
Suncraft Homes Inc
Purchase Details
Closed on
Dec 17, 1992
Sold by
Bell Tim L
Bought by
Suncraft Homes
Purchase Details
Closed on
Jun 10, 1991
Bought by
Bell Tim L
Create a Home Valuation Report for This Property
The Home Valuation Report is an in-depth analysis detailing your home's value as well as a comparison with similar homes in the area
Home Values in the Area
Average Home Value in this Area
Purchase History
| Date | Buyer | Sale Price | Title Company |
|---|---|---|---|
| Arlington Investments Llc | $90,300 | -- | |
| Deutsche Bank National Trust C | -- | -- | |
| Rosenberg Barry Marshall | -- | -- | |
| Rosenberg Barry | $326,500 | -- | |
| Bell Victoria Lelani | -- | -- | |
| Suncraft Homes Inc | -- | -- | |
| Suncraft Homes | $101,000 | -- | |
| Bell Tim L | $8,400 | -- |
Source: Public Records
Tax History Compared to Growth
Tax History
| Year | Tax Paid | Tax Assessment Tax Assessment Total Assessment is a certain percentage of the fair market value that is determined by local assessors to be the total taxable value of land and additions on the property. | Land | Improvement |
|---|---|---|---|---|
| 2024 | $3,396 | $150,107 | $4,653 | $145,454 |
| 2023 | $3,396 | $136,372 | $3,722 | $132,650 |
| 2022 | $2,732 | $108,927 | $2,482 | $106,445 |
| 2021 | $2,387 | $93,092 | $1,985 | $91,107 |
| 2020 | $2,128 | $82,893 | $1,805 | $81,088 |
| 2019 | $2,005 | $77,478 | $1,805 | $75,673 |
| 2018 | $1,846 | $70,313 | $1,805 | $68,508 |
| 2017 | $1,852 | $70,313 | $1,805 | $68,508 |
| 2016 | $1,853 | $70,313 | $1,805 | $68,508 |
| 2015 | $2,120 | $75,794 | $6,708 | $69,086 |
| 2014 | $2,128 | $75,794 | $6,708 | $69,086 |
Source: Public Records
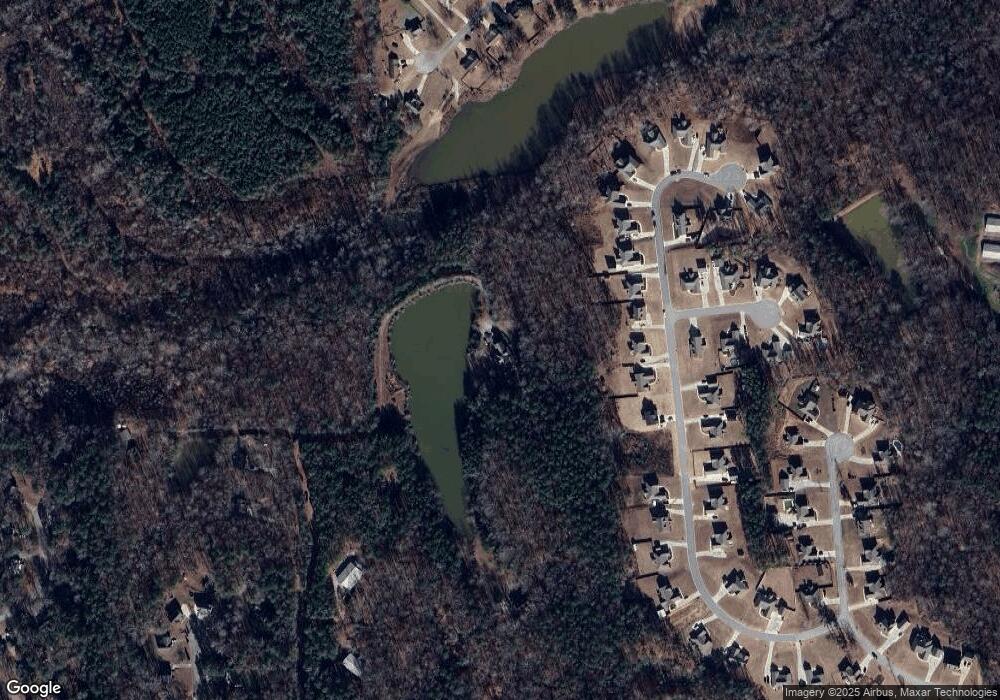
Map
Nearby Homes
- 337 Cranmore Place
- 132 Hunters Lake Dr
- 213 Cornell Ct
- 1052 Harlan Lane Rd
- 37 Tapley Rd
- 232 Harlan Heights Rd
- 328 Wesley Mill Place
- 104 Dalton Dr
- 1180 Harlan Lane Rd
- 436 Abbey Place
- 2505 Rockmart Rd
- 178 Cedars Glen Cir
- 100 Cedars Glen Cir
- 504 Iris Way
- 768 Legion Lake Rd
- 101 Cedars Glen Cir
- 1905 Rockmart Rd
- 424 Northstar Dr
- 420 Northstar Dr
- 418 Northstar Dr
- 426 Northstar Dr
- 416 Northstar Dr
- 441 Northstar Dr
- 500 Alta Ct
- 431 Northstar Dr
- 442 Northstar Dr
- 411 Northstar Dr
- 432 Northstar Dr
- 407 Northstar Dr
- 440 Northstar Dr
- 436 Northstar Dr
- 430 Northstar Dr
- 409 Northstar Dr
- 428 Northstar Dr
- 0 Alta Ct
- 417 Northstar Dr
- 414 Northstar Dr