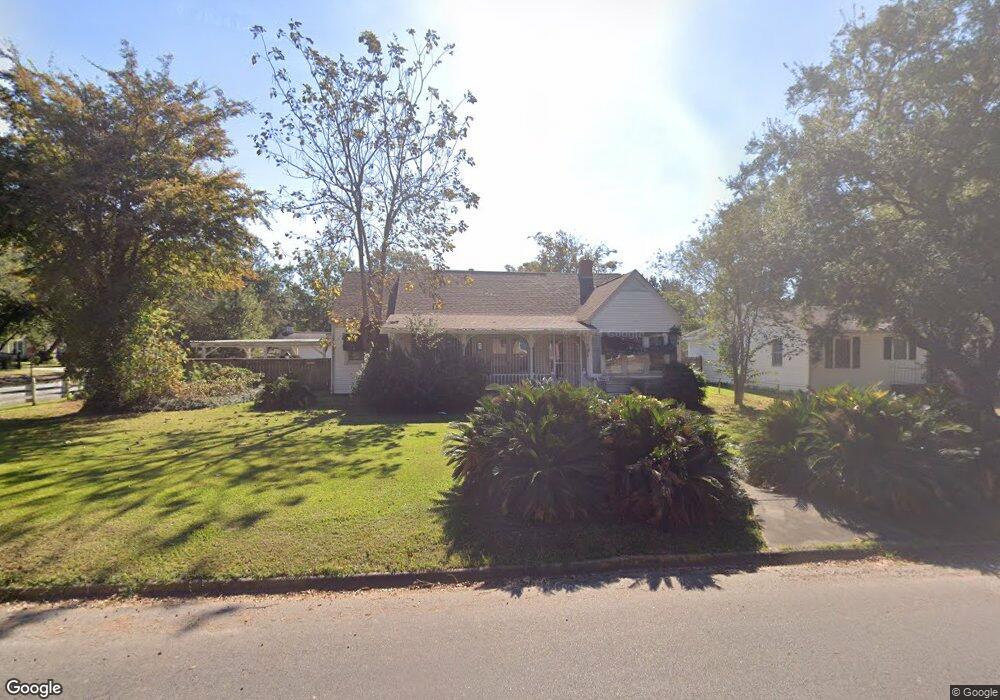
4340 Ferndale Dr Port Arthur, TX 77642
Estimated Value: $167,026 - $202,000
4
Beds
2
Baths
2,445
Sq Ft
$74/Sq Ft
Est. Value
About This Home
This home is located at 4340 Ferndale Dr, Port Arthur, TX 77642 and is currently estimated at $181,507, approximately $74 per square foot. 4340 Ferndale Dr is a home located in Jefferson County with nearby schools including Tyrrell Elementary School, Jefferson Middle School, and Memorial High School.
Ownership History
Date
Name
Owned For
Owner Type
Purchase Details
Closed on
Oct 15, 2015
Sold by
Spires Thomas L
Bought by
Gonzales Ismael D
Current Estimated Value
Home Financials for this Owner
Home Financials are based on the most recent Mortgage that was taken out on this home.
Original Mortgage
$65,000
Outstanding Balance
$25,513
Interest Rate
3.13%
Mortgage Type
Seller Take Back
Estimated Equity
$155,994
Purchase Details
Closed on
May 11, 2015
Sold by
Broussard Joseph E
Bought by
Spires Thomas L
Purchase Details
Closed on
Feb 16, 2010
Sold by
Mathes Claude D
Bought by
Johnson Joyce L
Purchase Details
Closed on
Nov 20, 2007
Sold by
Mathes Claude D
Bought by
The Johnson Family Trust
Purchase Details
Closed on
Apr 27, 2007
Sold by
Johnson Robert D and Johnson Joyce L
Bought by
Robert D & Joyce L Johnson Sr Revocable
Create a Home Valuation Report for This Property
The Home Valuation Report is an in-depth analysis detailing your home's value as well as a comparison with similar homes in the area
Home Values in the Area
Average Home Value in this Area
Purchase History
| Date | Buyer | Sale Price | Title Company |
|---|---|---|---|
| Gonzales Ismael D | -- | Attorney | |
| Spires Thomas L | -- | None Available | |
| Johnson Joyce L | -- | None Available | |
| The Johnson Family Trust | -- | None Available | |
| Robert D & Joyce L Johnson Sr Revocable | -- | None Available |
Source: Public Records
Mortgage History
| Date | Status | Borrower | Loan Amount |
|---|---|---|---|
| Open | Gonzales Ismael D | $65,000 |
Source: Public Records
Tax History Compared to Growth
Tax History
| Year | Tax Paid | Tax Assessment Tax Assessment Total Assessment is a certain percentage of the fair market value that is determined by local assessors to be the total taxable value of land and additions on the property. | Land | Improvement |
|---|---|---|---|---|
| 2025 | $4,316 | $150,109 | $13,500 | $136,609 |
| 2024 | $4,316 | $150,669 | $9,000 | $141,669 |
| 2023 | $4,316 | $150,669 | $9,000 | $141,669 |
| 2022 | $4,142 | $130,430 | $9,000 | $121,430 |
| 2021 | $3,820 | $115,252 | $9,000 | $106,252 |
| 2020 | $3,198 | $96,477 | $9,000 | $87,477 |
| 2019 | $2,809 | $88,150 | $9,000 | $79,150 |
| 2018 | $2,677 | $83,980 | $9,000 | $74,980 |
| 2017 | $2,602 | $83,980 | $9,000 | $74,980 |
| 2016 | $2,460 | $83,980 | $9,000 | $74,980 |
| 2015 | $2,726 | $91,320 | $9,000 | $82,320 |
| 2014 | $2,726 | $91,320 | $9,000 | $82,320 |
Source: Public Records
Map
Nearby Homes
- 2621 Evergreen Dr
- LOT 55 Royal Meadows Estate
- 4501 Springdale St
- 2515 Glenwood Dr
- 4034 32nd St
- 3412 Drexel Ave
- 2129 Neches Ave
- 3812 30th St
- 2325 Oaklawn Ave
- 2720 Royal Ave
- 3721 Avalon Ave
- 4100 Dryden Rd
- 3500 32nd St
- 4433 & 4435 Neches Ave
- 3836 Lexington Ave
- 3250 Woodlawn Dr
- 3930 Touraine Ave
- 2615 3rd Ave
- 3049 Canal Ave
- 5301 North St
- 4330 Ferndale Dr
- 4349 Forest Dr
- 4320 Ferndale Dr
- 2840 Evergreen Dr
- 4305 Forest Dr
- 4310 Ferndale Dr
- 4410 Ferndale Dr
- 2800 Evergreen Dr
- 4420 Ferndale Dr
- 2715 Evergreen Dr
- 2715 Evergreen Dr
- 2801 S Park Dr
- 4415 Forest Dr
- 2805 S Park Dr
- 2630 Rosedale Dr
- 4245 Forest Dr
- 4421 Highland Ave
- 4425 Forest Dr
- 4301 Ferndale Dr
- 4330 Sunken Ct