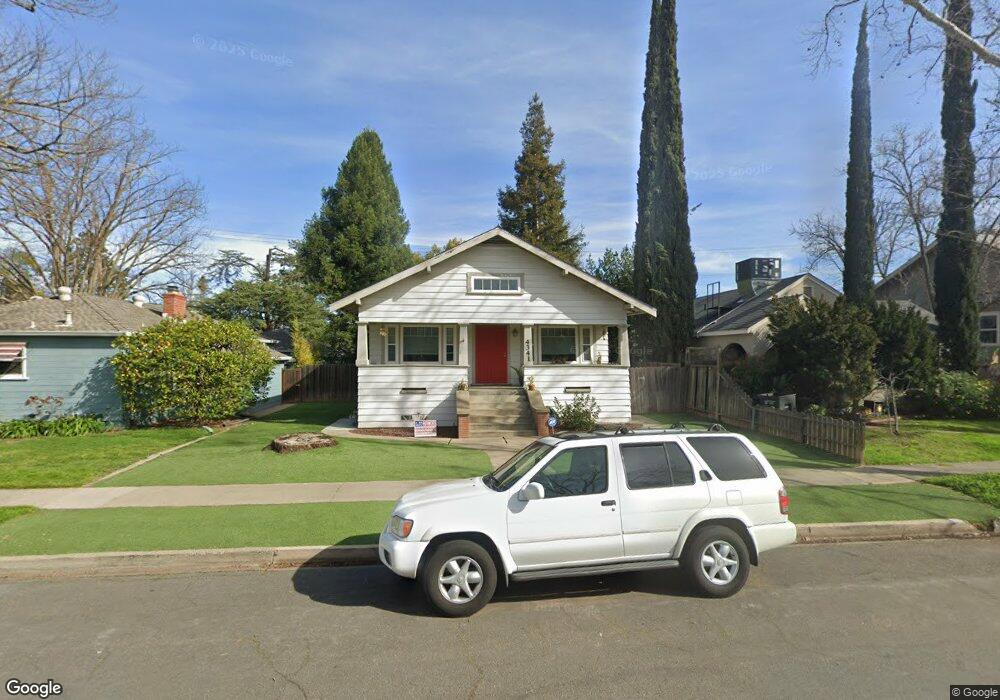
4341 55th St Sacramento, CA 95820
Colonial Heights NeighborhoodEstimated Value: $287,000 - $434,000
2
Beds
1
Bath
1,103
Sq Ft
$335/Sq Ft
Est. Value
About This Home
This home is located at 4341 55th St, Sacramento, CA 95820 and is currently estimated at $369,877, approximately $335 per square foot. 4341 55th St is a home located in Sacramento County with nearby schools including Mark Twain Elementary School, Umoja International Academy, and Hiram W. Johnson High School.
Ownership History
Date
Name
Owned For
Owner Type
Purchase Details
Closed on
Mar 5, 2019
Sold by
Bradford Tod R
Bought by
Bradford Tod R and Bradford Family Revocable Trus
Current Estimated Value
Purchase Details
Closed on
Apr 6, 2000
Sold by
Aames Capital Corp
Bought by
Bradford Tod R
Home Financials for this Owner
Home Financials are based on the most recent Mortgage that was taken out on this home.
Original Mortgage
$88,463
Outstanding Balance
$30,351
Interest Rate
8.25%
Mortgage Type
FHA
Estimated Equity
$339,526
Purchase Details
Closed on
Nov 30, 1999
Sold by
Knight James M and Knight Peggy J
Bought by
Aames Capital Corp
Purchase Details
Closed on
Jan 29, 1997
Sold by
Bogush Danny and Bogush Katherine
Bought by
Knight James M and Knight Peggy J
Home Financials for this Owner
Home Financials are based on the most recent Mortgage that was taken out on this home.
Original Mortgage
$57,500
Interest Rate
7.74%
Mortgage Type
Seller Take Back
Create a Home Valuation Report for This Property
The Home Valuation Report is an in-depth analysis detailing your home's value as well as a comparison with similar homes in the area
Home Values in the Area
Average Home Value in this Area
Purchase History
| Date | Buyer | Sale Price | Title Company |
|---|---|---|---|
| Bradford Tod R | -- | None Available | |
| Bradford Tod R | $66,500 | Fidelity National Title Co | |
| Aames Capital Corp | $50,331 | Fidelity National Title Ins | |
| Knight James M | $66,000 | Stewart Title |
Source: Public Records
Mortgage History
| Date | Status | Borrower | Loan Amount |
|---|---|---|---|
| Open | Bradford Tod R | $88,463 | |
| Previous Owner | Knight James M | $57,500 |
Source: Public Records
Tax History Compared to Growth
Tax History
| Year | Tax Paid | Tax Assessment Tax Assessment Total Assessment is a certain percentage of the fair market value that is determined by local assessors to be the total taxable value of land and additions on the property. | Land | Improvement |
|---|---|---|---|---|
| 2025 | $1,485 | $114,980 | $38,413 | $76,567 |
| 2024 | $1,485 | $112,726 | $37,660 | $75,066 |
| 2023 | $1,449 | $110,517 | $36,922 | $73,595 |
| 2022 | $1,426 | $108,351 | $36,199 | $72,152 |
| 2021 | $1,361 | $106,228 | $35,490 | $70,738 |
| 2020 | $1,370 | $105,140 | $35,127 | $70,013 |
| 2019 | $1,341 | $103,080 | $34,439 | $68,641 |
| 2018 | $1,306 | $101,060 | $33,764 | $67,296 |
| 2017 | $1,287 | $99,079 | $33,102 | $65,977 |
| 2016 | $1,233 | $97,137 | $32,453 | $64,684 |
| 2015 | $1,211 | $95,679 | $31,966 | $63,713 |
| 2014 | $1,180 | $93,805 | $31,340 | $62,465 |
Source: Public Records
Map
Nearby Homes