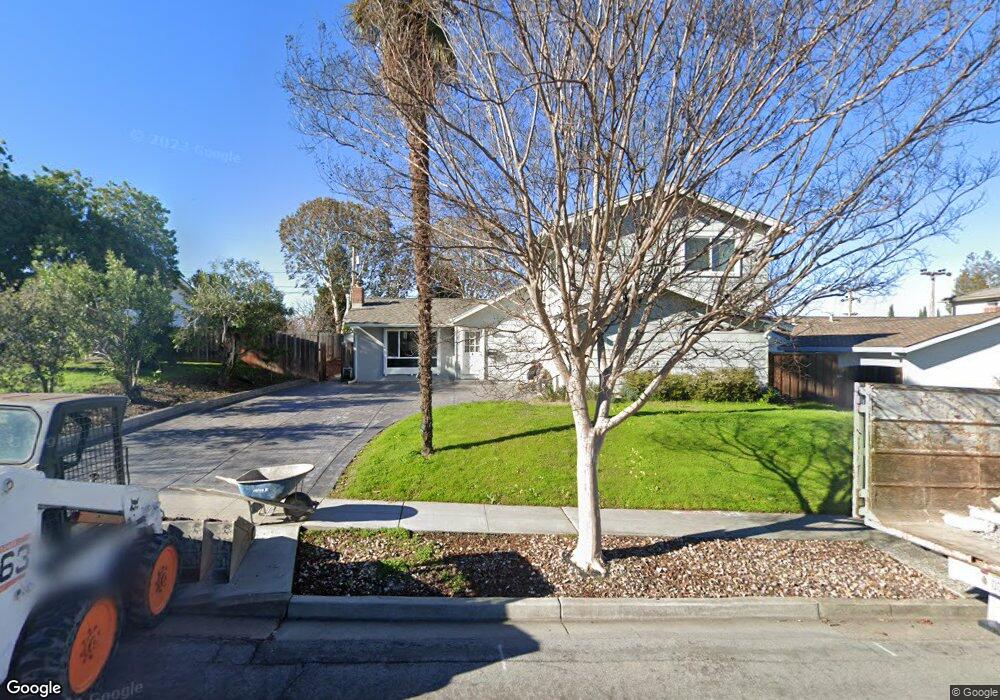
43431 Gallegos Ave Fremont, CA 94539
Mission San Jose NeighborhoodEstimated Value: $2,065,000 - $2,556,000
5
Beds
2
Baths
2,073
Sq Ft
$1,123/Sq Ft
Est. Value
About This Home
This home is located at 43431 Gallegos Ave, Fremont, CA 94539 and is currently estimated at $2,328,855, approximately $1,123 per square foot. 43431 Gallegos Ave is a home located in Alameda County with nearby schools including Mission San Jose Elementary School, William Hopkins Junior High School, and Mission San Jose High School.
Ownership History
Date
Name
Owned For
Owner Type
Purchase Details
Closed on
Feb 5, 2013
Sold by
Nesbit George D and Nesbit Wendy A
Bought by
Nesbit George D and Nesbit Wendy A
Current Estimated Value
Home Financials for this Owner
Home Financials are based on the most recent Mortgage that was taken out on this home.
Original Mortgage
$144,000
Outstanding Balance
$100,431
Interest Rate
3.36%
Mortgage Type
New Conventional
Estimated Equity
$2,228,424
Purchase Details
Closed on
Oct 15, 2009
Sold by
Nesbit George D and Nesbit Wendy A
Bought by
The 2009 George D Nesbit & Wendy A Nesbi
Purchase Details
Closed on
Oct 20, 1993
Sold by
Prokop Charles D and Prokop Edwina C
Bought by
Nesbit George D and Nesbit Wendy A
Home Financials for this Owner
Home Financials are based on the most recent Mortgage that was taken out on this home.
Original Mortgage
$190,000
Interest Rate
6.81%
Mortgage Type
Purchase Money Mortgage
Create a Home Valuation Report for This Property
The Home Valuation Report is an in-depth analysis detailing your home's value as well as a comparison with similar homes in the area
Home Values in the Area
Average Home Value in this Area
Purchase History
| Date | Buyer | Sale Price | Title Company |
|---|---|---|---|
| Nesbit George D | -- | First American Title | |
| The 2009 George D Nesbit & Wendy A Nesbi | -- | None Available | |
| Nesbit George D | $237,500 | Fidelity National Title Ins |
Source: Public Records
Mortgage History
| Date | Status | Borrower | Loan Amount |
|---|---|---|---|
| Open | Nesbit George D | $144,000 | |
| Closed | Nesbit George D | $190,000 |
Source: Public Records
Tax History Compared to Growth
Tax History
| Year | Tax Paid | Tax Assessment Tax Assessment Total Assessment is a certain percentage of the fair market value that is determined by local assessors to be the total taxable value of land and additions on the property. | Land | Improvement |
|---|---|---|---|---|
| 2025 | $5,281 | $407,811 | $121,011 | $293,800 |
| 2024 | $5,281 | $399,679 | $118,639 | $288,040 |
| 2023 | $5,126 | $398,706 | $116,313 | $282,393 |
| 2022 | $5,114 | $383,888 | $114,032 | $276,856 |
| 2021 | $4,992 | $376,224 | $111,796 | $271,428 |
| 2020 | $4,951 | $379,295 | $110,650 | $268,645 |
| 2019 | $4,839 | $366,957 | $108,481 | $258,476 |
| 2018 | $4,683 | $354,762 | $106,354 | $248,408 |
| 2017 | $4,566 | $347,808 | $104,269 | $243,539 |
| 2016 | $4,479 | $340,990 | $102,225 | $238,765 |
Source: Public Records
Map
Nearby Homes
- 905 Glenhill Dr
- 341 Dana St
- 483 Becado Place
- 463 Becado Place
- 646 Bella Vista Ct
- 43382 Bryant St
- 43547 Ellsworth St
- 335 Via Rosario
- 2164 Ocaso Camino
- 1873 Berry Ct
- 42955 Corte Verde
- 42965 Corte Verde
- 42329 Troyer Ave
- 138 Telles Ln
- 600 Praderia Cir
- 2450 Euclid Place
- 124 Linmore Dr
- 2225 Valorie St
- 41997 Via San Gabriel
- 379 Felipe Common
- 43447 Gallegos Ave
- 43415 Gallegos Ave
- 43399 Gallegos Ave
- 43463 Gallegos Ave
- 792 Nandina Ct
- 791 Nandina Ct
- 895 Glenhill Dr
- 43383 Gallegos Ave
- 793 Glenhill Ct
- 885 Glenhill Dr
- 845 Glenhill Dr
- 780 Nandina Ct
- 779 Nandina Ct
- 925 Glenhill Dr
- 781 Glenhill Ct
- 43501 Gallegos Ave
- 798 Alsion Ct
- 43367 Gallegos Ave
- 865 Glenhill Dr
- 935 Glenhill Dr