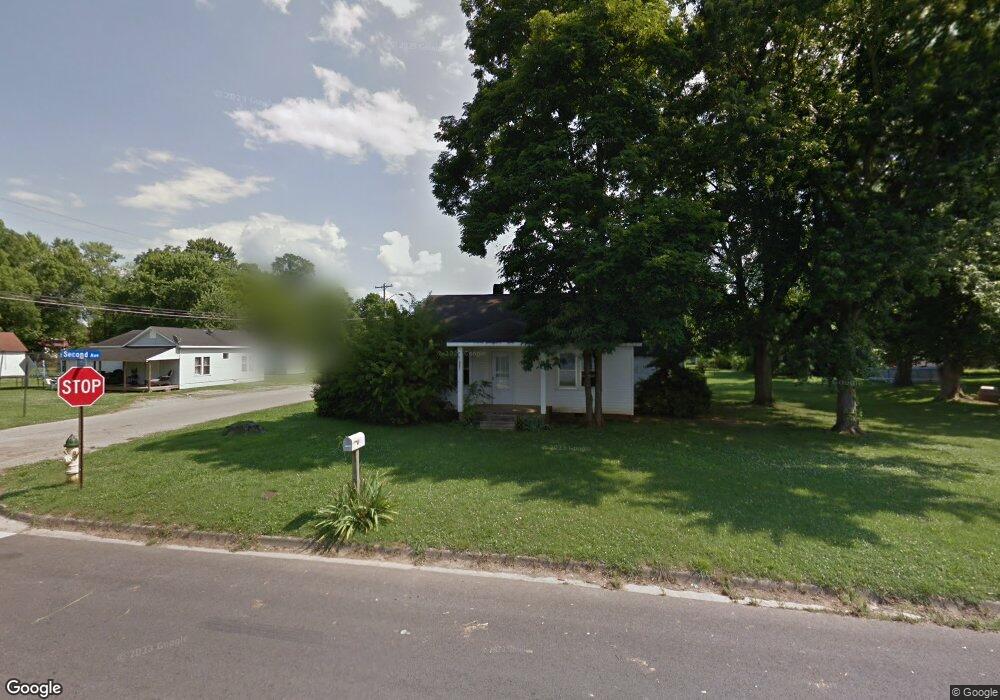
435 5th St Lawrenceburg, TN 38464
Estimated Value: $42,761 - $84,000
--
Bed
1
Bath
780
Sq Ft
$75/Sq Ft
Est. Value
About This Home
This home is located at 435 5th St, Lawrenceburg, TN 38464 and is currently estimated at $58,190, approximately $74 per square foot. 435 5th St is a home located in Lawrence County with nearby schools including Ingram Sowell Elementary School, Lawrenceburg Public Elementary School, and David Crockett Elementary School.
Ownership History
Date
Name
Owned For
Owner Type
Purchase Details
Closed on
Dec 13, 2024
Sold by
Duke Josh
Bought by
Woodson Richard
Current Estimated Value
Purchase Details
Closed on
Sep 24, 2024
Sold by
Ludeking David
Bought by
Duke Josh
Purchase Details
Closed on
Jul 19, 2007
Sold by
Mckee Richard J
Bought by
David Ludeking
Purchase Details
Closed on
Sep 27, 2005
Sold by
Winford Calhoun Leamon
Bought by
Mckee Richard J
Home Financials for this Owner
Home Financials are based on the most recent Mortgage that was taken out on this home.
Original Mortgage
$28,000
Interest Rate
7.13%
Purchase Details
Closed on
Nov 5, 1986
Bought by
Calhoun Leamon W and Wife Sue Ann
Purchase Details
Closed on
Jan 1, 1983
Create a Home Valuation Report for This Property
The Home Valuation Report is an in-depth analysis detailing your home's value as well as a comparison with similar homes in the area
Home Values in the Area
Average Home Value in this Area
Purchase History
| Date | Buyer | Sale Price | Title Company |
|---|---|---|---|
| Woodson Richard | $40,000 | None Listed On Document | |
| Duke Josh | $20,000 | None Listed On Document | |
| David Ludeking | $35,000 | -- | |
| Mckee Richard J | $35,000 | -- | |
| Calhoun Leamon W | -- | -- | |
| -- | -- | -- |
Source: Public Records
Mortgage History
| Date | Status | Borrower | Loan Amount |
|---|---|---|---|
| Previous Owner | Not Available | $28,000 |
Source: Public Records
Tax History Compared to Growth
Tax History
| Year | Tax Paid | Tax Assessment Tax Assessment Total Assessment is a certain percentage of the fair market value that is determined by local assessors to be the total taxable value of land and additions on the property. | Land | Improvement |
|---|---|---|---|---|
| 2025 | $468 | $15,075 | $0 | $0 |
| 2024 | $468 | $15,075 | $3,000 | $12,075 |
| 2023 | $468 | $15,075 | $3,000 | $12,075 |
| 2022 | $468 | $15,075 | $3,000 | $12,075 |
| 2021 | $416 | $9,475 | $2,000 | $7,475 |
| 2020 | $416 | $9,475 | $2,000 | $7,475 |
| 2019 | $416 | $9,475 | $2,000 | $7,475 |
| 2018 | $416 | $9,475 | $2,000 | $7,475 |
| 2017 | $416 | $9,475 | $2,000 | $7,475 |
| 2016 | $416 | $9,475 | $2,000 | $7,475 |
| 2015 | $394 | $9,475 | $2,000 | $7,475 |
| 2014 | $374 | $8,975 | $2,000 | $6,975 |
Source: Public Records
Map
Nearby Homes