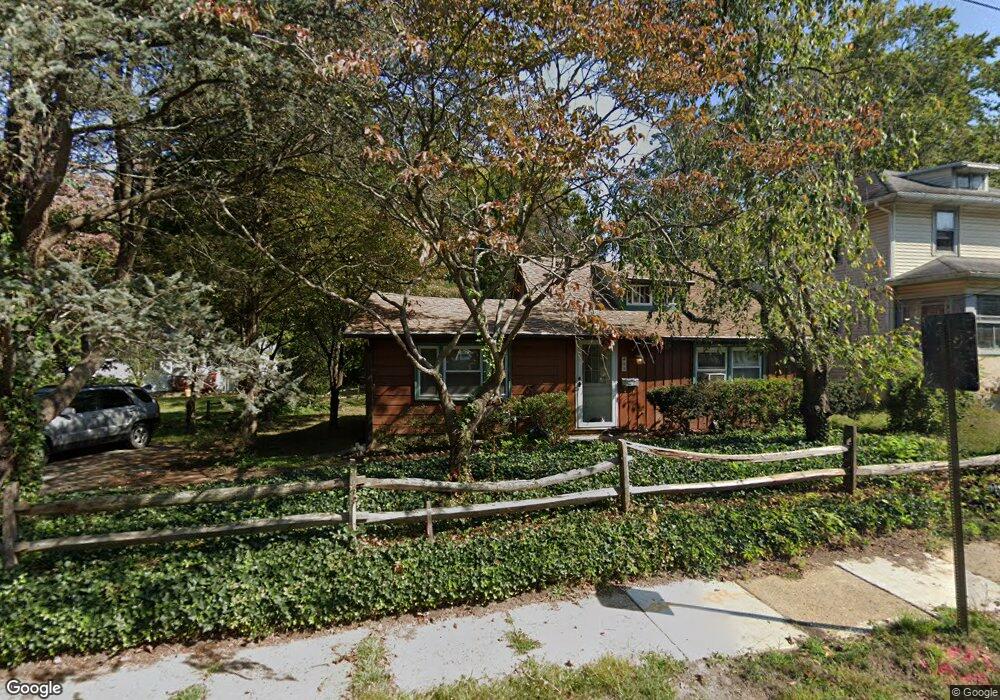
435 Lake Blvd Lindenwold, NJ 08021
Estimated Value: $234,224 - $275,000
2
Beds
1
Bath
1,108
Sq Ft
$231/Sq Ft
Est. Value
About This Home
This home is located at 435 Lake Blvd, Lindenwold, NJ 08021 and is currently estimated at $256,306, approximately $231 per square foot. 435 Lake Blvd is a home located in Camden County with nearby schools including Memorial Middle School, Lindenwold High School, and Saint John Paul II Regional School.
Ownership History
Date
Name
Owned For
Owner Type
Purchase Details
Closed on
Nov 18, 2005
Sold by
Maguire Tracey
Bought by
George Debra
Current Estimated Value
Home Financials for this Owner
Home Financials are based on the most recent Mortgage that was taken out on this home.
Original Mortgage
$108,000
Outstanding Balance
$59,974
Interest Rate
6.36%
Estimated Equity
$196,332
Purchase Details
Closed on
Jun 14, 2002
Sold by
Hetrick Virginia J
Bought by
Maguire Tracey
Home Financials for this Owner
Home Financials are based on the most recent Mortgage that was taken out on this home.
Original Mortgage
$96,978
Interest Rate
6.64%
Mortgage Type
FHA
Create a Home Valuation Report for This Property
The Home Valuation Report is an in-depth analysis detailing your home's value as well as a comparison with similar homes in the area
Home Values in the Area
Average Home Value in this Area
Purchase History
| Date | Buyer | Sale Price | Title Company |
|---|---|---|---|
| George Debra | $155,000 | -- | |
| Maguire Tracey | $98,500 | -- |
Source: Public Records
Mortgage History
| Date | Status | Borrower | Loan Amount |
|---|---|---|---|
| Open | George Debra | $108,000 | |
| Previous Owner | Maguire Tracey | $96,978 |
Source: Public Records
Tax History Compared to Growth
Tax History
| Year | Tax Paid | Tax Assessment Tax Assessment Total Assessment is a certain percentage of the fair market value that is determined by local assessors to be the total taxable value of land and additions on the property. | Land | Improvement |
|---|---|---|---|---|
| 2025 | $4,920 | $99,500 | $43,000 | $56,500 |
| 2024 | $4,947 | $99,500 | $43,000 | $56,500 |
| 2023 | $4,947 | $99,500 | $43,000 | $56,500 |
| 2022 | $4,942 | $99,500 | $43,000 | $56,500 |
| 2021 | $4,723 | $99,500 | $43,000 | $56,500 |
| 2020 | $5,049 | $99,500 | $43,000 | $56,500 |
| 2019 | $5,093 | $99,500 | $43,000 | $56,500 |
| 2018 | $5,080 | $99,500 | $43,000 | $56,500 |
| 2017 | $4,928 | $99,500 | $43,000 | $56,500 |
| 2016 | $4,818 | $99,500 | $43,000 | $56,500 |
| 2015 | $4,615 | $99,500 | $43,000 | $56,500 |
| 2014 | $4,414 | $99,500 | $43,000 | $56,500 |
Source: Public Records
Map
Nearby Homes