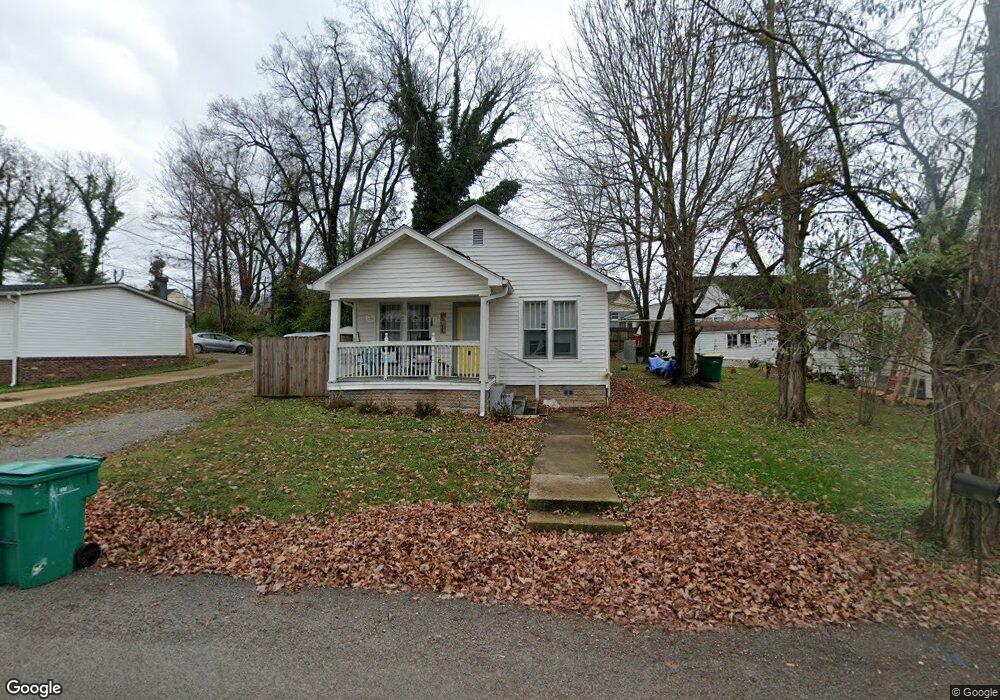
435 Maple St Lewisburg, TN 37091
Estimated Value: $148,065 - $174,000
2
Beds
1
Bath
784
Sq Ft
$200/Sq Ft
Est. Value
About This Home
This home is located at 435 Maple St, Lewisburg, TN 37091 and is currently estimated at $156,766, approximately $199 per square foot. 435 Maple St is a home located in Marshall County with nearby schools including Marshall Elementary School, Oak Grove Elementary School, and Westhills Elementary School.
Ownership History
Date
Name
Owned For
Owner Type
Purchase Details
Closed on
Mar 11, 2022
Sold by
Leslie Woodward
Bought by
Woodward Chad
Current Estimated Value
Purchase Details
Closed on
Jul 15, 2015
Sold by
Grooms Brittany M
Bought by
Woodward Leslie and Woodward Chad
Purchase Details
Closed on
May 9, 2013
Sold by
Seeber Brittany M Grooms
Bought by
Seeber Jeffery P
Purchase Details
Closed on
Sep 13, 2007
Sold by
Coleman Franklin D
Bought by
Brittany Grooms
Home Financials for this Owner
Home Financials are based on the most recent Mortgage that was taken out on this home.
Original Mortgage
$45,900
Interest Rate
6.57%
Purchase Details
Closed on
Aug 1, 2005
Sold by
Bob Smart
Bought by
Franklin Coleman and Franklin Naomi
Purchase Details
Closed on
Sep 7, 2001
Sold by
Allen Haislip H and Allen Jewell
Bought by
Bob Smartt and Bob Sharrin
Purchase Details
Closed on
May 24, 1988
Bought by
Haislip H Allen H and Haislip Jewell
Create a Home Valuation Report for This Property
The Home Valuation Report is an in-depth analysis detailing your home's value as well as a comparison with similar homes in the area
Home Values in the Area
Average Home Value in this Area
Purchase History
| Date | Buyer | Sale Price | Title Company |
|---|---|---|---|
| Woodward Chad | -- | First Commerce Title | |
| Woodward Leslie | $4,182 | -- | |
| Seeber Jeffery P | -- | -- | |
| Brittany Grooms | $45,900 | -- | |
| Franklin Coleman | $25,000 | -- | |
| Bob Smartt | $20,600 | -- | |
| Haislip H Allen H | $17,600 | -- |
Source: Public Records
Mortgage History
| Date | Status | Borrower | Loan Amount |
|---|---|---|---|
| Previous Owner | Haislip H Allen H | $45,900 |
Source: Public Records
Tax History Compared to Growth
Tax History
| Year | Tax Paid | Tax Assessment Tax Assessment Total Assessment is a certain percentage of the fair market value that is determined by local assessors to be the total taxable value of land and additions on the property. | Land | Improvement |
|---|---|---|---|---|
| 2024 | -- | $23,175 | $2,000 | $21,175 |
| 2023 | $719 | $23,175 | $2,000 | $21,175 |
| 2022 | $719 | $23,175 | $2,000 | $21,175 |
| 2021 | $643 | $13,825 | $1,200 | $12,625 |
| 2020 | $643 | $13,825 | $1,200 | $12,625 |
| 2019 | $623 | $13,825 | $1,200 | $12,625 |
| 2018 | $616 | $13,825 | $1,200 | $12,625 |
| 2017 | $616 | $13,825 | $1,200 | $12,625 |
| 2016 | $603 | $11,775 | $1,000 | $10,775 |
| 2015 | $550 | $11,775 | $1,000 | $10,775 |
| 2014 | $550 | $11,775 | $1,000 | $10,775 |
Source: Public Records
Map
Nearby Homes
- 525 Maple St
- 518 Maple St
- 610 Forrest St
- 215 5th Ave N
- 726 Thomas Ave
- 0 New Lake Rd Unit RTC3030964
- 316 Haynes St
- 640 6th Ave S
- 416 1st Ave N
- 632 Colburn Dr
- 319 E Hill Ave
- 543 2nd Ave N
- 594 5th Ave N
- 630 6th Ave N
- 627 6th Ave N
- 535 Clayton Ave
- 966 Berry St
- 638 2nd Ave N
- 117 W End Ave N
- 319 Greenwood St