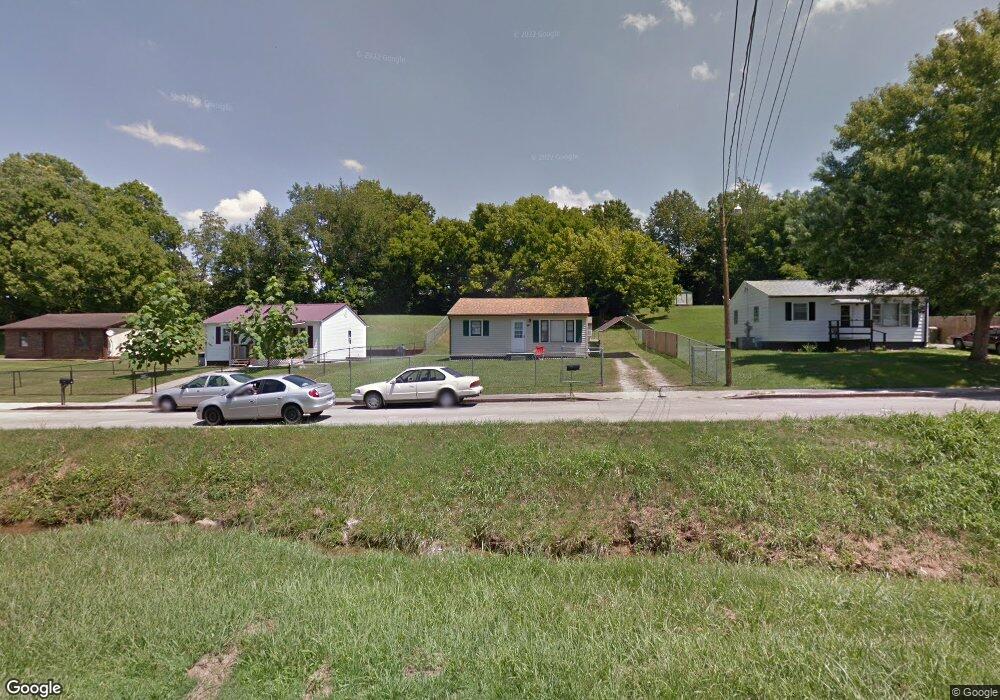
435 Valley St Morristown, TN 37813
Estimated Value: $114,000 - $195,000
--
Bed
1
Bath
696
Sq Ft
$201/Sq Ft
Est. Value
About This Home
This home is located at 435 Valley St, Morristown, TN 37813 and is currently estimated at $139,729, approximately $200 per square foot. 435 Valley St is a home located in Hamblen County with nearby schools including Lincoln Heights Elementary School, Lincoln Heights Middle School, and Morristown West High School.
Ownership History
Date
Name
Owned For
Owner Type
Purchase Details
Closed on
Jun 16, 2011
Sold by
Collins Estelle Q
Bought by
Collins Estelle Q and Suffridge Natalie
Current Estimated Value
Purchase Details
Closed on
Jul 21, 2009
Sold by
Bowlin Elmo
Bought by
Collins Estelle Q
Purchase Details
Closed on
Jun 13, 2007
Sold by
Collins Estelle Q
Bought by
Imogene Bowlin
Purchase Details
Closed on
Oct 5, 2000
Sold by
Mills Glenn W and Mills Gwen
Bought by
Collins Estelle Q
Purchase Details
Closed on
Feb 10, 1986
Bought by
Mills Glenn W and Mills Gwen
Purchase Details
Closed on
Apr 26, 1980
Bought by
Mills Terry C and Mills Bonnie L
Purchase Details
Closed on
Mar 21, 1979
Bought by
Horner Paul A and Dorothy Jean
Create a Home Valuation Report for This Property
The Home Valuation Report is an in-depth analysis detailing your home's value as well as a comparison with similar homes in the area
Home Values in the Area
Average Home Value in this Area
Purchase History
| Date | Buyer | Sale Price | Title Company |
|---|---|---|---|
| Collins Estelle Q | $3,500 | -- | |
| Collins Estelle Q | -- | -- | |
| Imogene Bowlin | -- | -- | |
| Collins Estelle Q | $30,000 | -- | |
| Mills Glenn W | $20,000 | -- | |
| Mills Terry C | $12,500 | -- | |
| Horner Paul A | $11,000 | -- |
Source: Public Records
Tax History Compared to Growth
Tax History
| Year | Tax Paid | Tax Assessment Tax Assessment Total Assessment is a certain percentage of the fair market value that is determined by local assessors to be the total taxable value of land and additions on the property. | Land | Improvement |
|---|---|---|---|---|
| 2024 | $236 | $13,400 | $3,100 | $10,300 |
| 2023 | $236 | $13,400 | $0 | $0 |
| 2022 | $424 | $13,400 | $3,100 | $10,300 |
| 2021 | $424 | $13,400 | $3,100 | $10,300 |
| 2020 | $423 | $13,400 | $3,100 | $10,300 |
| 2019 | $390 | $11,450 | $2,700 | $8,750 |
| 2018 | $361 | $11,450 | $2,700 | $8,750 |
| 2017 | $355 | $11,450 | $2,700 | $8,750 |
| 2016 | $339 | $11,450 | $2,700 | $8,750 |
| 2015 | $315 | $11,450 | $2,700 | $8,750 |
| 2014 | -- | $11,450 | $2,700 | $8,750 |
| 2013 | -- | $12,575 | $0 | $0 |
Source: Public Records
Map
Nearby Homes
- 440 S Fairmont Ave
- 837 Pauline Ave
- 731 Lennie Ave
- 203 Lincoln Ave
- 900 Baird Ave
- 816 W 2nd St N
- 1530 Rayburn Dr
- 722 W 2nd St N
- 1002 Watercrest St
- 1211 W 6th St N
- 1476 Darbee Dr
- 323 Pauline Ave
- 811 Crescent St
- 529 N Jackson St
- 2078 Edgewater Sound Rd
- 1442 Darbee Dr
- 0 Mcfarland St
- 435 S Hill St
- 707 Walters Dr
- 912 N Church St