435 Valley View Ave Felton, CA 95018
Zayante NeighborhoodEstimated Value: $486,000 - $771,000
2
Beds
1
Bath
1,055
Sq Ft
$615/Sq Ft
Est. Value
About This Home
This home is located at 435 Valley View Ave, Felton, CA 95018 and is currently estimated at $648,642, approximately $614 per square foot. 435 Valley View Ave is a home located in Santa Cruz County with nearby schools including San Lorenzo Valley Elementary School, San Lorenzo Valley Middle School, and San Lorenzo Valley High School.
Ownership History
Date
Name
Owned For
Owner Type
Purchase Details
Closed on
May 30, 2011
Sold by
Weyrauch Martin and Janssen Weyrauch Janet
Bought by
Weyrauch Martin and Janssen Weyrauch Janet M
Current Estimated Value
Purchase Details
Closed on
Nov 3, 2003
Sold by
Kornher Gordon K and Boudreau Katherine Lenn
Bought by
Weyrauch Martin and Janssen Weyrauch Janet
Purchase Details
Closed on
Apr 7, 1994
Sold by
Kornher John L and Kornher Meryl
Bought by
Kornher Gordon K and Boudreau Katherine Lenn
Home Financials for this Owner
Home Financials are based on the most recent Mortgage that was taken out on this home.
Original Mortgage
$71,500
Interest Rate
10.4%
Purchase Details
Closed on
Feb 28, 1994
Sold by
Kornher John L and Kornher Meryl
Bought by
Kornher John L and Kornher Meryl
Home Financials for this Owner
Home Financials are based on the most recent Mortgage that was taken out on this home.
Original Mortgage
$71,500
Interest Rate
10.4%
Create a Home Valuation Report for This Property
The Home Valuation Report is an in-depth analysis detailing your home's value as well as a comparison with similar homes in the area
Home Values in the Area
Average Home Value in this Area
Purchase History
| Date | Buyer | Sale Price | Title Company |
|---|---|---|---|
| Weyrauch Martin | -- | None Available | |
| Weyrauch Martin | $200,000 | First American Title Co | |
| Kornher Gordon K | -- | Old Republic Title Co | |
| Kornher John L | -- | Old Republic Title Co |
Source: Public Records
Mortgage History
| Date | Status | Borrower | Loan Amount |
|---|---|---|---|
| Previous Owner | Kornher Gordon K | $71,500 |
Source: Public Records
Tax History Compared to Growth
Tax History
| Year | Tax Paid | Tax Assessment Tax Assessment Total Assessment is a certain percentage of the fair market value that is determined by local assessors to be the total taxable value of land and additions on the property. | Land | Improvement |
|---|---|---|---|---|
| 2025 | $4,156 | $327,018 | $284,362 | $42,656 |
| 2023 | $4,148 | $314,320 | $273,320 | $41,000 |
| 2022 | $4,047 | $308,156 | $267,960 | $40,196 |
| 2021 | $3,881 | $302,114 | $262,706 | $39,408 |
| 2020 | $3,738 | $299,016 | $260,012 | $39,004 |
| 2019 | $3,553 | $293,152 | $254,914 | $38,238 |
| 2018 | $3,488 | $287,404 | $249,916 | $37,488 |
| 2017 | $3,435 | $281,770 | $245,014 | $36,756 |
| 2016 | $3,379 | $275,607 | $239,659 | $35,948 |
| 2015 | $3,037 | $248,295 | $215,909 | $32,386 |
| 2014 | $2,527 | $201,866 | $175,536 | $26,330 |
Source: Public Records
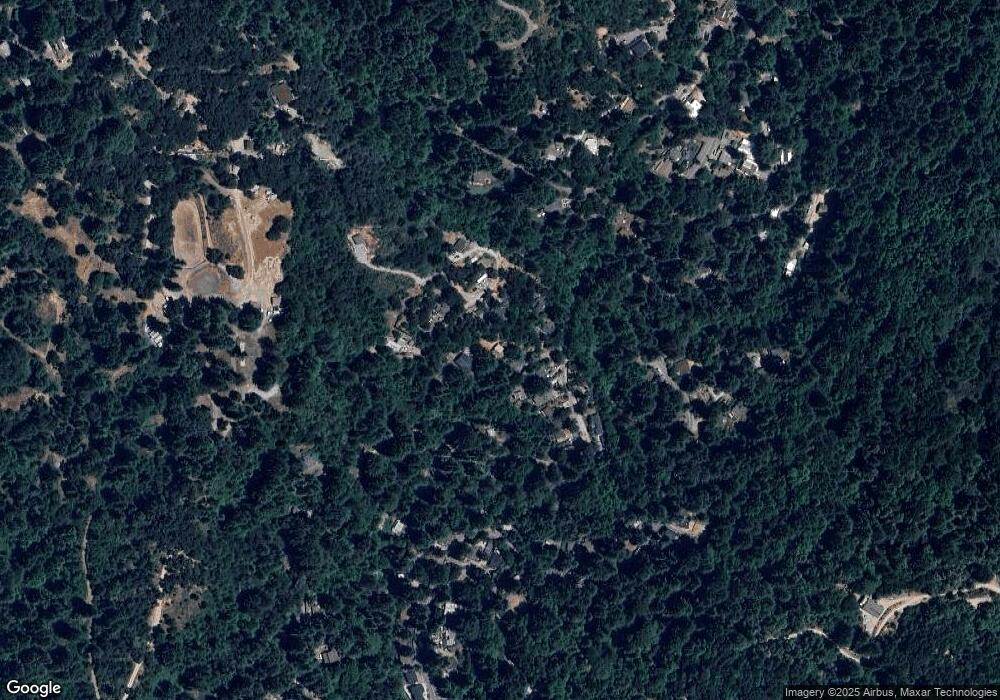
Map
Nearby Homes
- 9540 E Zayante Rd
- 10158 E Zayante Rd
- Lot 08 Lake Blvd and Lot 38 Lakeview
- 11120 Lake Blvd
- Lot 34 Lake Blvd
- 0 Lake Blvd Unit ML82023518
- 10229 Redwood Dr
- 11507 Lakeview Ave
- 10664 E Zayante Rd
- Lot 26 Lakeview Ave
- Lot 02 Lakeview Ave
- 10348 West Dr
- Lot 12 Vera Ave
- 880 Sunrise Ridge
- 000 Lompico Rd
- 0 Old Mill Rd Unit OC25221127
- 10001 West Dr
- 0 Idlewild St
- Lot 11 Volver Ave
- Lot 28 La Lena St
- 9470 Zayante Dr
- 425 Valley View Ave
- 9480 Zayante Dr
- 455 Valley View Ave
- 453 Creekside Way
- 430 Valley View Ave
- 9457 Zayante Dr
- 9490 Zayante Dr
- 441 Creekside Way
- 9495 Zayante Dr
- 435 Creekside Way
- 315 Creekside Way
- 329 Creekside Way
- 423 Creekside Way
- 9409 Zayante Dr
- 9515 Zayante Dr
- 415 Creekside Way
- 0 Creekside Way
- 430 Creekside Way
- 9711 E Zayante Rd