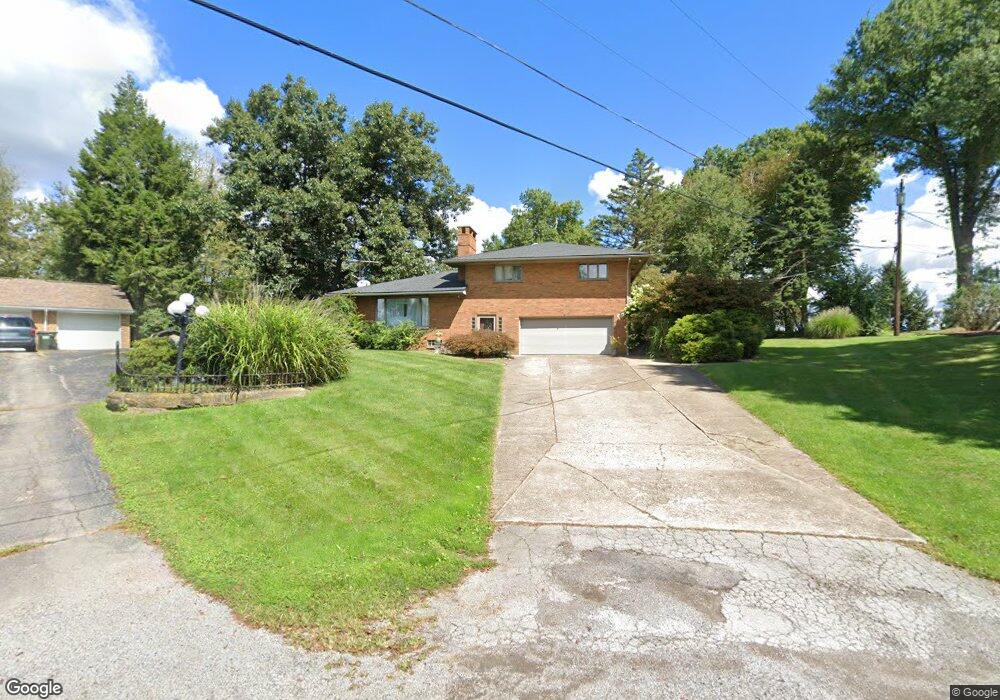
435 Watterson St East Liverpool, OH 43920
Estimated Value: $184,000 - $238,000
3
Beds
3
Baths
1,400
Sq Ft
$144/Sq Ft
Est. Value
About This Home
This home is located at 435 Watterson St, East Liverpool, OH 43920 and is currently estimated at $202,053, approximately $144 per square foot. 435 Watterson St is a home located in Columbiana County with nearby schools including Westgate Middle School, North Elementary School, and East Liverpool High School.
Ownership History
Date
Name
Owned For
Owner Type
Purchase Details
Closed on
Nov 26, 2021
Sold by
Rose Dawn M
Bought by
Rose Andrew L
Current Estimated Value
Purchase Details
Closed on
Mar 12, 2002
Sold by
Trust 120 Millward Sara L Trustee Sara L Mill
Bought by
Rose Andrew L and Rose Dawn M
Purchase Details
Closed on
Dec 16, 1993
Bought by
Millward Sara L
Create a Home Valuation Report for This Property
The Home Valuation Report is an in-depth analysis detailing your home's value as well as a comparison with similar homes in the area
Home Values in the Area
Average Home Value in this Area
Purchase History
| Date | Buyer | Sale Price | Title Company |
|---|---|---|---|
| Rose Andrew L | -- | None Available | |
| Rose Andrew L | $83,500 | -- | |
| Millward Sara L | -- | -- |
Source: Public Records
Tax History Compared to Growth
Tax History
| Year | Tax Paid | Tax Assessment Tax Assessment Total Assessment is a certain percentage of the fair market value that is determined by local assessors to be the total taxable value of land and additions on the property. | Land | Improvement |
|---|---|---|---|---|
| 2024 | $2,008 | $49,250 | $10,360 | $38,890 |
| 2023 | $2,008 | $49,250 | $10,360 | $38,890 |
| 2022 | $2,009 | $49,250 | $10,360 | $38,890 |
| 2021 | $1,824 | $41,620 | $10,400 | $31,220 |
| 2020 | $1,827 | $41,620 | $10,400 | $31,220 |
| 2019 | $1,826 | $41,620 | $10,400 | $31,220 |
| 2018 | $1,767 | $37,840 | $9,450 | $28,390 |
| 2017 | $1,864 | $37,840 | $9,450 | $28,390 |
| 2016 | $1,849 | $37,040 | $8,720 | $28,320 |
| 2015 | $1,849 | $37,040 | $8,720 | $28,320 |
| 2014 | $1,797 | $37,040 | $8,720 | $28,320 |
Source: Public Records
Map
Nearby Homes
- 3170 Hampton Ct
- 3124 Gilson Ave
- 3150 Forest Hills Dr
- 3158 Forest Hills Dr
- 3244 Saint Clair Ave
- 3164 Forest Hills Dr
- 3140 Forest Hills Dr
- 3165 Forest Hills Dr
- 3135 Forest Hills Dr
- 3178 Forest Hills Dr
- 3186 Forest Hills Dr
- 3173 Forest Hills Dr
- 3194 Forest Hills Dr
- 3177 Forest Hills Dr
- 3105 Forest Hills Dr
- 306 Imperial Dr
- 147 Huntington Ct
- 3140 Curry St
- 140 Huntington Ct
- 138 Huntington Ct
- 431 Watterson St
- 639 Broadview Cir
- 376 Broadview Cir
- 645 Broadview Cir
- 651 Broadview Cir
- 651 Broadview Cir
- 411 Watterson St
- 3204 Leland Dr
- 561 Pond St
- 530 Pleasant St
- 657 Broadview Cir
- 571 Pond St
- 588 Pleasant St
- 640 Broadview Cir
- 401 Watterson St
- 634 Broadview Cir
- 646 Broadview Cir
- 581 Pond St
- 652 Broadview Cir
- 628 Broadview Cir