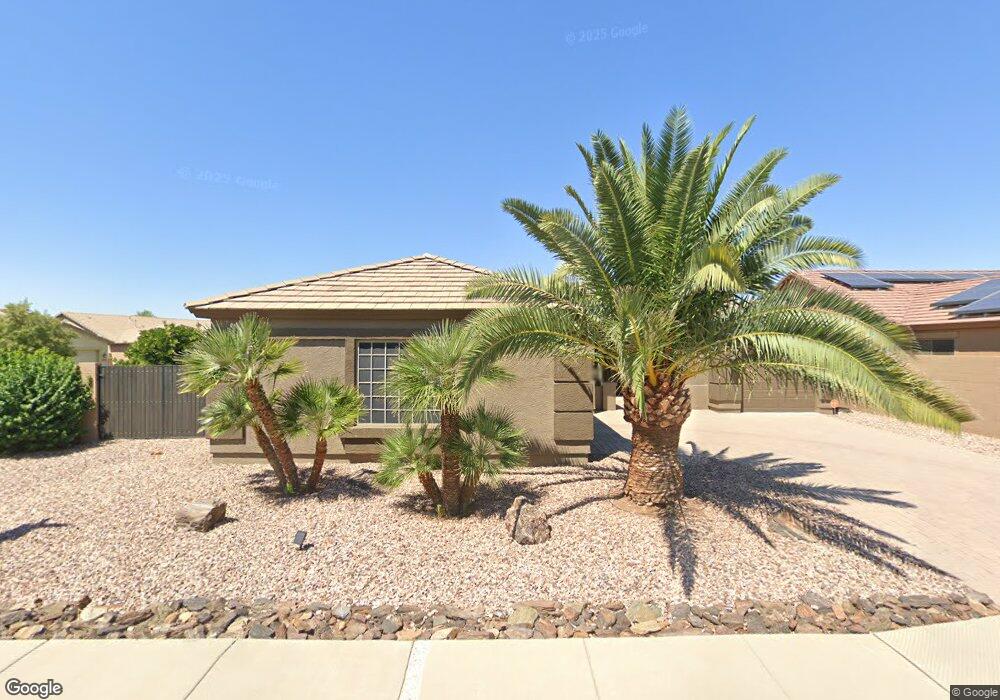
43568 W Neely Dr Maricopa, AZ 85138
Rancho El Dorado NeighborhoodEstimated Value: $341,703 - $405,000
4
Beds
2
Baths
2,079
Sq Ft
$183/Sq Ft
Est. Value
About This Home
This home is located at 43568 W Neely Dr, Maricopa, AZ 85138 and is currently estimated at $380,426, approximately $182 per square foot. 43568 W Neely Dr is a home located in Pinal County with nearby schools including Butterfield Elementary School, Maricopa High School, and Maricopa Wells Middle School.
Ownership History
Date
Name
Owned For
Owner Type
Purchase Details
Closed on
Dec 3, 2013
Sold by
Klimek John F
Bought by
Klimek John F and Reinecke Kathleen D
Current Estimated Value
Purchase Details
Closed on
Jun 28, 2010
Sold by
Fannie Mae
Bought by
Klimek John F
Home Financials for this Owner
Home Financials are based on the most recent Mortgage that was taken out on this home.
Original Mortgage
$146,686
Outstanding Balance
$97,961
Interest Rate
4.82%
Mortgage Type
VA
Estimated Equity
$282,465
Purchase Details
Closed on
Apr 7, 2010
Sold by
Metlife Home Loans
Bought by
Federal National Mortgage Association
Purchase Details
Closed on
Mar 15, 2010
Sold by
Cornish Charles E and Cornish Shannon
Bought by
Metlife Home Loans
Purchase Details
Closed on
Feb 9, 2006
Sold by
Canterra Homes Inc
Bought by
Cornish Charles E and Cornish Shannon
Home Financials for this Owner
Home Financials are based on the most recent Mortgage that was taken out on this home.
Original Mortgage
$247,193
Interest Rate
6.28%
Mortgage Type
Unknown
Create a Home Valuation Report for This Property
The Home Valuation Report is an in-depth analysis detailing your home's value as well as a comparison with similar homes in the area
Home Values in the Area
Average Home Value in this Area
Purchase History
| Date | Buyer | Sale Price | Title Company |
|---|---|---|---|
| Klimek John F | -- | None Available | |
| Klimek John F | $142,000 | Stewart Title & Trust Of Pho | |
| Federal National Mortgage Association | -- | Lawyers Title Company | |
| Metlife Home Loans | $267,038 | Lawyers Title Company | |
| Cornish Charles E | $308,992 | First American Title Ins Co | |
| Canterra Homes Inc | -- | First American Title Ins Co | |
| Canterra Contracting Llc | -- | First American Title Ins Co |
Source: Public Records
Mortgage History
| Date | Status | Borrower | Loan Amount |
|---|---|---|---|
| Open | Klimek John F | $146,686 | |
| Previous Owner | Cornish Charles E | $247,193 | |
| Closed | Cornish Charles E | $61,799 |
Source: Public Records
Tax History Compared to Growth
Tax History
| Year | Tax Paid | Tax Assessment Tax Assessment Total Assessment is a certain percentage of the fair market value that is determined by local assessors to be the total taxable value of land and additions on the property. | Land | Improvement |
|---|---|---|---|---|
| 2025 | $2,087 | $29,699 | -- | -- |
| 2024 | $1,975 | $37,565 | -- | -- |
| 2023 | $2,033 | $27,285 | $0 | $0 |
| 2022 | $1,975 | $20,388 | $3,833 | $16,555 |
| 2021 | $1,885 | $18,979 | $0 | $0 |
| 2020 | $1,800 | $16,226 | $0 | $0 |
| 2019 | $1,731 | $15,006 | $0 | $0 |
| 2018 | $1,708 | $14,042 | $0 | $0 |
| 2017 | $1,627 | $13,327 | $0 | $0 |
| 2016 | $1,465 | $13,596 | $1,250 | $12,346 |
| 2014 | $1,399 | $8,981 | $1,000 | $7,981 |
Source: Public Records
Map
Nearby Homes
- 19776 N Harris Dr
- 43581 W Mccord Dr
- 19969 N Santa Cruz Dr
- 20200 N Donithan Way
- 43906 W Mcclelland Dr
- 43460 W Caven Dr
- 43192 W Oster Dr
- 43531 W Bailey Dr
- 20226 N Madison Dr
- 44014 W Mccord Dr
- 43228 W Knauss Dr
- 43760 W Magnolia Rd
- 20139 N Bustos Way
- 44027 W Caven Dr
- 43348 W Wild Horse Trail
- 43851 W Griffis Dr
- 43641 W Kramer Ln
- 19667 N Marquez Cir
- 20443 N Santa Cruz Dr
- 44014 W Magnolia Rd
- 43542 W Neely Dr
- 43524 W Neely Dr
- 43533 W Harris Dr
- 43543 W Neely Dr
- 19856 N Harris Dr
- 19796 N Harris Dr
- 43504 W Neely Dr
- 43525 W Neely Dr
- 43574 W Harris Dr
- 43505 W Neely Dr
- 43493 W Harris Dr
- 43486 W Neely Dr
- 43540 W Harris Dr
- 19756 N Harris Dr
- 43542 W Mccord Dr
- 43524 W Mccord Dr
- 43522 W Harris Dr
- 43466 W Neely Dr
- 43475 W Harris Dr
- 19736 N Harris Dr