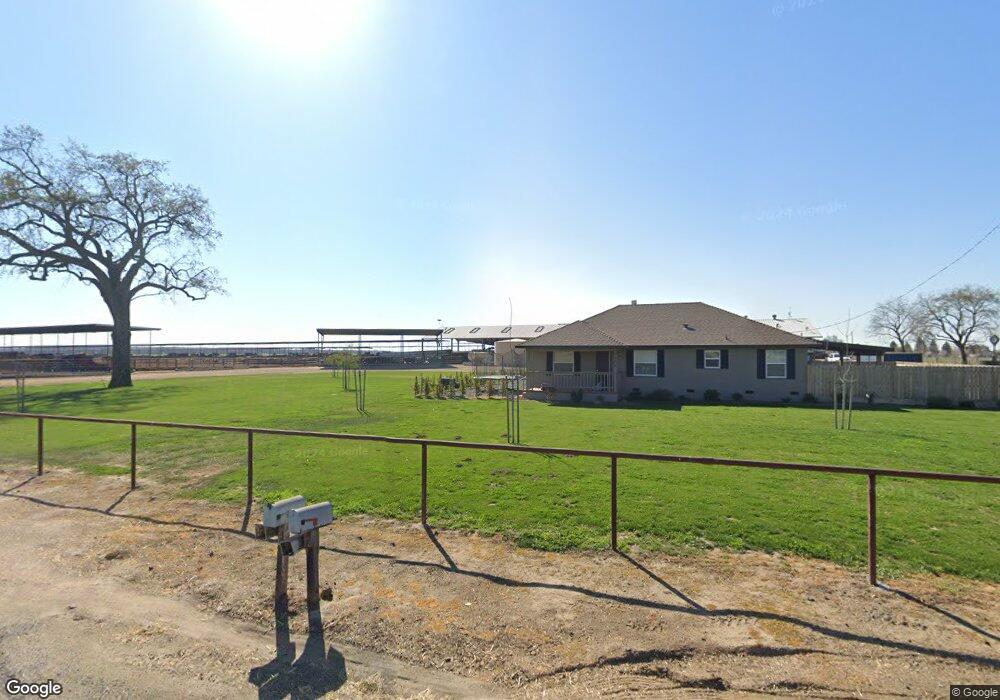
4357 N Oakmore St Tulare, CA 93274
Estimated Value: $310,505 - $660,000
--
Bed
--
Bath
--
Sq Ft
0.37
Acres
About This Home
This home is located at 4357 N Oakmore St, Tulare, CA 93274 and is currently estimated at $479,835. 4357 N Oakmore St is a home located in Tulare County with nearby schools including Liberty Elementary School, Tulare Western High School, and Accelerated Charter High.
Ownership History
Date
Name
Owned For
Owner Type
Purchase Details
Closed on
Aug 26, 2010
Sold by
Poel Vivien Vander
Bought by
Poel Vivien Vander and Vivien Vander Poel Survivors Trust
Current Estimated Value
Purchase Details
Closed on
Dec 1, 2004
Sold by
Mendonca Carl A
Bought by
Poel Pete Vander and Vanderpoel Vivien
Home Financials for this Owner
Home Financials are based on the most recent Mortgage that was taken out on this home.
Original Mortgage
$660,000
Outstanding Balance
$328,546
Interest Rate
5.64%
Mortgage Type
Seller Take Back
Estimated Equity
$151,289
Purchase Details
Closed on
Oct 15, 2004
Sold by
Mendonca George I
Bought by
Mendonca Carl A and Mendonca Rosemary
Home Financials for this Owner
Home Financials are based on the most recent Mortgage that was taken out on this home.
Original Mortgage
$660,000
Outstanding Balance
$328,546
Interest Rate
5.64%
Mortgage Type
Seller Take Back
Estimated Equity
$151,289
Create a Home Valuation Report for This Property
The Home Valuation Report is an in-depth analysis detailing your home's value as well as a comparison with similar homes in the area
Home Values in the Area
Average Home Value in this Area
Purchase History
| Date | Buyer | Sale Price | Title Company |
|---|---|---|---|
| Poel Vivien Vander | -- | None Available | |
| Poel Pete Vander | $960,000 | Chicago Title Co | |
| Mendonca Carl A | -- | Chicago Title Co |
Source: Public Records
Mortgage History
| Date | Status | Borrower | Loan Amount |
|---|---|---|---|
| Open | Poel Pete Vander | $660,000 |
Source: Public Records
Tax History Compared to Growth
Tax History
| Year | Tax Paid | Tax Assessment Tax Assessment Total Assessment is a certain percentage of the fair market value that is determined by local assessors to be the total taxable value of land and additions on the property. | Land | Improvement |
|---|---|---|---|---|
| 2025 | $442 | $40,492 | $1,275 | $39,217 |
| 2024 | $442 | $39,699 | $1,250 | $38,449 |
| 2023 | $434 | $38,922 | $1,226 | $37,696 |
| 2022 | $421 | $38,159 | $1,202 | $36,957 |
| 2021 | $414 | $37,410 | $1,178 | $36,232 |
| 2020 | $421 | $37,026 | $1,166 | $35,860 |
| 2019 | $433 | $36,300 | $1,143 | $35,157 |
| 2018 | $429 | $35,589 | $1,121 | $34,468 |
| 2017 | $429 | $34,891 | $1,099 | $33,792 |
| 2016 | $410 | $34,206 | $1,077 | $33,129 |
| 2015 | $404 | $33,692 | $1,061 | $32,631 |
| 2014 | $397 | $33,032 | $1,040 | $31,992 |
Source: Public Records
Map
Nearby Homes
- 3012 N Oakmore St
- 2852 Ruby Port St Unit Sor61
- 3116 Seymour St
- 3125 Seymour St
- 3637 Luke St
- 2090 Chancellor Ave
- 0 N Mooney Blvd
- 2828 Ruby Port St Unit Sor59
- 2840 Ruby Port St Unit Sor60
- 26484 Mulanax Dr
- 3126 Dorset St
- 3012 N Oakmore Rd
- 3096 Markham St
- 2826 Dorset St Unit Sor35
- 2863 Dorset St Unit Sor53
- 2850 Dorset St Unit Sor37
- 2875 Dorset St Unit Sor52
- 2889 Dorset St Unit Sor51
- 26814 S Mooney Blvd Unit D156
- 26814 S Mooney Blvd Unit B45
- 4402 N Oakmore St
- 3380 E Oakdale Ave
- 3323 E Oakdale Ave
- 3223 E Oakdale Ave
- 3236 E Oakdale Ave
- 3173 E Oakdale Ave
- 3173 E Oakdale Ave
- 25859 Road 124
- 3000 E Oakdale Ave
- 3688 N Oakmore St
- 12703 Avenue 256
- 25891 Road 124
- 2865 E Oakdale Ave
- 2569 E Oakdale Ave
- 2551 E Oakdale Ave
- 2567 E Oakdale Ave
- 2505 E Oakdale Ave
- 3231 N Oakmore St
- 4190 N Mooney Blvd
- 2433 E Oakdale Ave