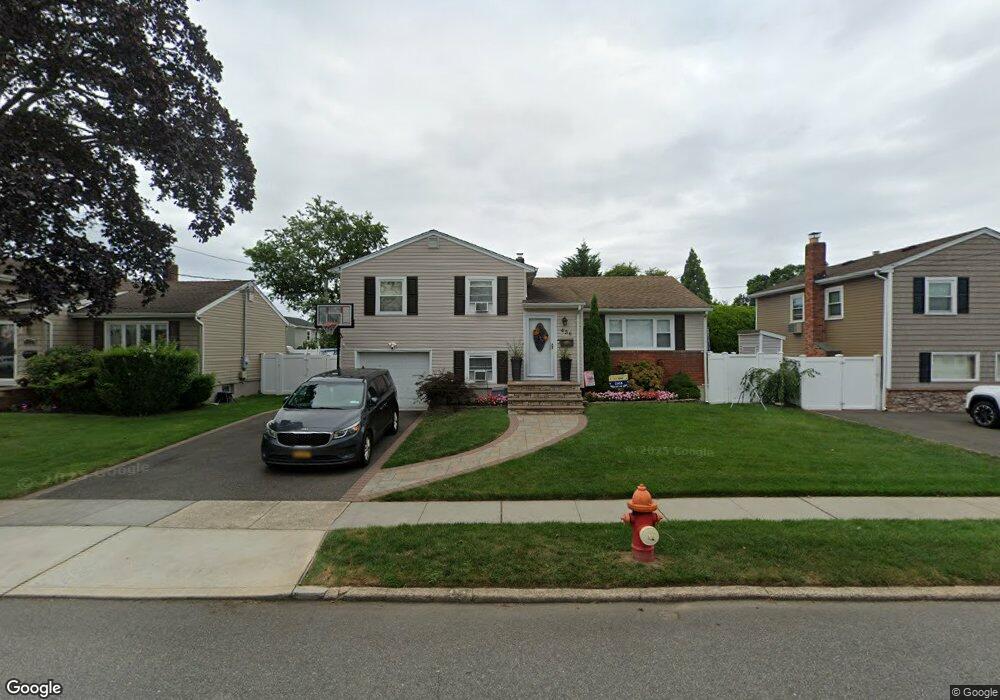
436 Charles Ave Massapequa Park, NY 11762
Estimated Value: $703,081 - $830,000
--
Bed
3
Baths
1,088
Sq Ft
$705/Sq Ft
Est. Value
About This Home
This home is located at 436 Charles Ave, Massapequa Park, NY 11762 and is currently estimated at $766,541, approximately $704 per square foot. 436 Charles Ave is a home located in Nassau County with nearby schools including Berner Middle School, Massapequa High School - Ames Campus, and Massapequa High School.
Ownership History
Date
Name
Owned For
Owner Type
Purchase Details
Closed on
Jun 30, 2010
Sold by
Green Ruth E and Wurtzel Betty
Bought by
Giordano Giuseppe and Giordano Allison S
Current Estimated Value
Home Financials for this Owner
Home Financials are based on the most recent Mortgage that was taken out on this home.
Original Mortgage
$347,138
Outstanding Balance
$231,828
Interest Rate
4.82%
Mortgage Type
Purchase Money Mortgage
Estimated Equity
$534,713
Create a Home Valuation Report for This Property
The Home Valuation Report is an in-depth analysis detailing your home's value as well as a comparison with similar homes in the area
Home Values in the Area
Average Home Value in this Area
Purchase History
| Date | Buyer | Sale Price | Title Company |
|---|---|---|---|
| Giordano Giuseppe | $352,000 | -- |
Source: Public Records
Mortgage History
| Date | Status | Borrower | Loan Amount |
|---|---|---|---|
| Open | Giordano Giuseppe | $347,138 |
Source: Public Records
Tax History Compared to Growth
Tax History
| Year | Tax Paid | Tax Assessment Tax Assessment Total Assessment is a certain percentage of the fair market value that is determined by local assessors to be the total taxable value of land and additions on the property. | Land | Improvement |
|---|---|---|---|---|
| 2025 | $11,870 | $479 | $203 | $276 |
| 2024 | $3,339 | $479 | $203 | $276 |
| 2023 | $11,133 | $479 | $203 | $276 |
| 2022 | $11,133 | $479 | $203 | $276 |
| 2021 | $11,107 | $462 | $196 | $266 |
| 2020 | $11,004 | $720 | $672 | $48 |
| 2019 | $10,652 | $720 | $672 | $48 |
| 2018 | $9,752 | $720 | $0 | $0 |
| 2017 | $5,771 | $720 | $634 | $86 |
| 2016 | $8,522 | $763 | $584 | $179 |
| 2015 | $2,718 | $805 | $616 | $189 |
| 2014 | $2,718 | $805 | $616 | $189 |
| 2013 | $2,774 | $878 | $672 | $206 |
Source: Public Records
Map
Nearby Homes