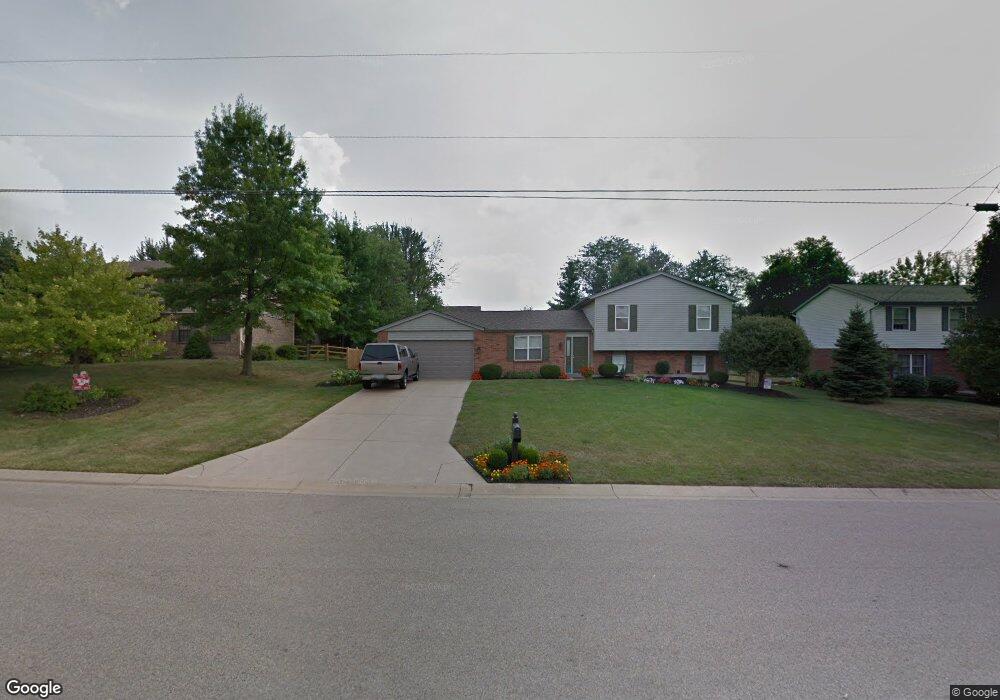
4367 Carthel Dr Liberty Township, OH 45011
Estimated Value: $309,000 - $360,000
3
Beds
2
Baths
1,728
Sq Ft
$194/Sq Ft
Est. Value
About This Home
This home is located at 4367 Carthel Dr, Liberty Township, OH 45011 and is currently estimated at $335,255, approximately $194 per square foot. 4367 Carthel Dr is a home located in Butler County with nearby schools including Cherokee Elementary School, Heritage Early Childhood School, and Lakota Plains Junior School.
Ownership History
Date
Name
Owned For
Owner Type
Purchase Details
Closed on
Mar 28, 2008
Sold by
Connor Gerard W and Connor Julia L
Bought by
Spencer Heather A and Fox Ralph J
Current Estimated Value
Home Financials for this Owner
Home Financials are based on the most recent Mortgage that was taken out on this home.
Original Mortgage
$147,900
Outstanding Balance
$94,322
Interest Rate
6.1%
Mortgage Type
Purchase Money Mortgage
Estimated Equity
$240,933
Purchase Details
Closed on
Aug 2, 1999
Sold by
Erp Kimberly A and Huening Kimberly A
Bought by
Connor Gerard W and Connor Julia L
Home Financials for this Owner
Home Financials are based on the most recent Mortgage that was taken out on this home.
Original Mortgage
$118,100
Interest Rate
6.37%
Mortgage Type
Purchase Money Mortgage
Purchase Details
Closed on
Jul 1, 1992
Purchase Details
Closed on
Dec 1, 1991
Create a Home Valuation Report for This Property
The Home Valuation Report is an in-depth analysis detailing your home's value as well as a comparison with similar homes in the area
Home Values in the Area
Average Home Value in this Area
Purchase History
| Date | Buyer | Sale Price | Title Company |
|---|---|---|---|
| Spencer Heather A | $157,900 | Prodigy Title Agency | |
| Connor Gerard W | $149,000 | -- | |
| -- | $87,000 | -- | |
| -- | $21,500 | -- |
Source: Public Records
Mortgage History
| Date | Status | Borrower | Loan Amount |
|---|---|---|---|
| Open | Spencer Heather A | $147,900 | |
| Previous Owner | Connor Gerard W | $118,100 | |
| Closed | Connor Gerard W | $7,900 |
Source: Public Records
Tax History Compared to Growth
Tax History
| Year | Tax Paid | Tax Assessment Tax Assessment Total Assessment is a certain percentage of the fair market value that is determined by local assessors to be the total taxable value of land and additions on the property. | Land | Improvement |
|---|---|---|---|---|
| 2024 | $3,320 | $84,410 | $12,380 | $72,030 |
| 2023 | $3,279 | $89,570 | $12,380 | $77,190 |
| 2022 | $2,978 | $59,990 | $12,380 | $47,610 |
| 2021 | $2,962 | $59,990 | $12,380 | $47,610 |
| 2020 | $3,039 | $59,990 | $12,380 | $47,610 |
| 2019 | $4,913 | $51,000 | $11,190 | $39,810 |
| 2018 | $2,887 | $51,000 | $11,190 | $39,810 |
| 2017 | $2,942 | $51,000 | $11,190 | $39,810 |
| 2016 | $2,600 | $44,740 | $11,190 | $33,550 |
| 2015 | $2,573 | $44,740 | $11,190 | $33,550 |
| 2014 | $2,678 | $44,740 | $11,190 | $33,550 |
| 2013 | $2,678 | $44,530 | $11,190 | $33,340 |
Source: Public Records
Map
Nearby Homes
- 4328 Palomino Ln
- 5765 Keshena Dr
- 4334 Palomino Ln
- 5870 Shetland Ct
- 5861 Mill Crest Ct
- 6077 Snow Hill Dr
- 6093 Griffin Ct
- 0 Liberty Square Dr
- 4706 Oakview Ct
- 5901 Jenny Marie Ct
- 5863 Eldon Dr
- 4821 Osprey Pointe Dr
- 5868 Greenlawn Rd
- 4926 Pebble Ct
- 4930 Pebble Ct
- 4934 Pebble Ct
- 4938 Pebble Ct
- 4946 Pebble Ct
- 4830 Cobblestone Ln
- 5791 Greenlawn Rd
- 4377 Carthel Dr
- 4357 Carthel Dr
- 4387 Carthel Dr
- 4347 Carthel Dr
- 5825 Furlong Way
- 5815 Furlong Way
- 5835 Furlong Way
- 5805 Furlong Way
- 4397 Carthel Dr
- 4374 Carthel Dr
- 4337 Carthel Dr
- 4358 Carthel Dr
- 4342 Carthel Dr
- 4386 Carthel Dr
- 5845 Furlong Way
- 5795 Furlong Way
- 4396 Furlong Way
- 4407 Carthel Dr
- 4396 Carthel Dr
- 4327 Carthel Dr