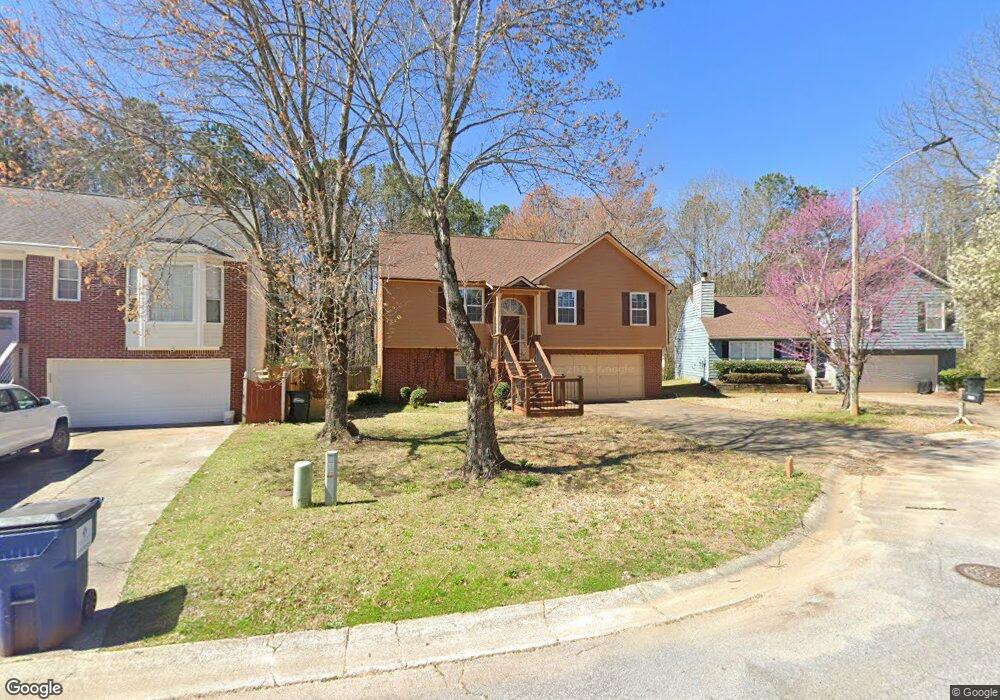
4371 Yellow Rose Dr Austell, GA 30106
Estimated Value: $289,952 - $306,000
3
Beds
3
Baths
1,244
Sq Ft
$242/Sq Ft
Est. Value
About This Home
This home is located at 4371 Yellow Rose Dr, Austell, GA 30106 and is currently estimated at $300,488, approximately $241 per square foot. 4371 Yellow Rose Dr is a home located in Cobb County with nearby schools including Deerwood Elementary School, Clarkdale Elementary School, and Garrett Middle School.
Ownership History
Date
Name
Owned For
Owner Type
Purchase Details
Closed on
Sep 2, 2025
Sold by
Sharpe Opportunity Intermediate Trust
Bought by
1S Reo Opportunity 1 Llc
Current Estimated Value
Purchase Details
Closed on
Jun 18, 2021
Sold by
Wims Angela L
Bought by
Alw Management Consulting Group Llc
Purchase Details
Closed on
Apr 25, 1997
Sold by
Anton Settle and Wros Susan L
Bought by
Wims Angela L
Home Financials for this Owner
Home Financials are based on the most recent Mortgage that was taken out on this home.
Original Mortgage
$96,585
Interest Rate
7.95%
Purchase Details
Closed on
Aug 26, 1993
Sold by
Bock David Homes Lp
Bought by
Settele Anton Susan L
Home Financials for this Owner
Home Financials are based on the most recent Mortgage that was taken out on this home.
Original Mortgage
$87,000
Interest Rate
7.19%
Create a Home Valuation Report for This Property
The Home Valuation Report is an in-depth analysis detailing your home's value as well as a comparison with similar homes in the area
Home Values in the Area
Average Home Value in this Area
Purchase History
| Date | Buyer | Sale Price | Title Company |
|---|---|---|---|
| 1S Reo Opportunity 1 Llc | $230,000 | None Listed On Document | |
| Alw Management Consulting Group Llc | -- | None Available | |
| Wims Angela L | $98,900 | -- | |
| Settele Anton Susan L | $95,000 | -- |
Source: Public Records
Mortgage History
| Date | Status | Borrower | Loan Amount |
|---|---|---|---|
| Previous Owner | Wims Angela L | $96,585 | |
| Previous Owner | Settele Anton Susan L | $87,000 |
Source: Public Records
Tax History Compared to Growth
Tax History
| Year | Tax Paid | Tax Assessment Tax Assessment Total Assessment is a certain percentage of the fair market value that is determined by local assessors to be the total taxable value of land and additions on the property. | Land | Improvement |
|---|---|---|---|---|
| 2025 | $3,334 | $110,648 | $19,200 | $91,448 |
| 2024 | $2,740 | $90,892 | $14,000 | $76,892 |
| 2023 | $2,740 | $90,892 | $14,000 | $76,892 |
| 2022 | $2,759 | $90,892 | $14,000 | $76,892 |
| 2021 | $2,340 | $77,084 | $14,000 | $63,084 |
| 2020 | $1,883 | $62,056 | $12,000 | $50,056 |
| 2019 | $1,883 | $62,056 | $12,000 | $50,056 |
| 2018 | $1,810 | $59,640 | $12,000 | $47,640 |
| 2017 | $1,715 | $59,640 | $12,000 | $47,640 |
| 2016 | $1,398 | $48,620 | $10,000 | $38,620 |
| 2015 | $871 | $29,556 | $14,000 | $15,556 |
| 2014 | $878 | $29,556 | $0 | $0 |
Source: Public Records
Map
Nearby Homes
- 4367 Yellow Rose Dr
- 4375 Yellow Rose Dr
- 4363 Yellow Rose Dr
- 4379 Yellow Rose Dr
- 4366 Yellow Rose Dr
- 4383 Yellow Rose Dr
- 4359 Yellow Rose Dr
- 4384 Yellow Rose Dr
- 0 Yellow Rose Dr Unit 8691472
- 0 Yellow Rose Dr Unit 8646529
- 0 Yellow Rose Dr Unit 8698935
- 0 Yellow Rose Dr Unit 8908528
- 4358 Yellow Rose Dr
- 4387 Yellow Rose Dr
- 4355 Yellow Rose Dr
- 4392 Yellow Rose Dr
- 4354 Yellow Rose Dr
- 4391 Yellow Rose Dr
- 4347 Chaucer Place Unit 1
- 4351 Yellow Rose Dr