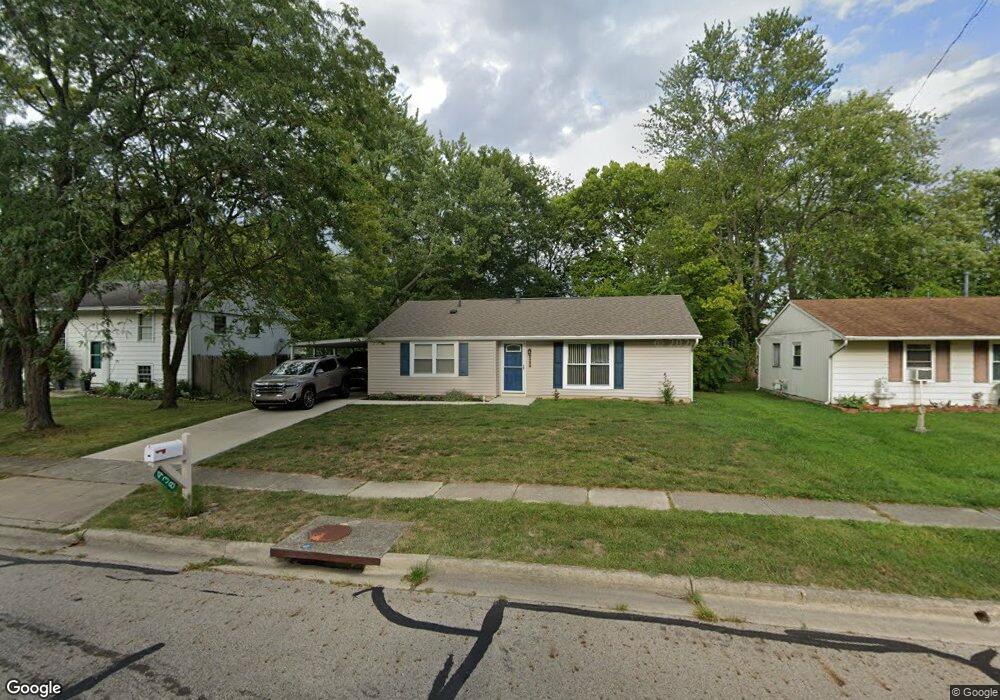
438 Benson Dr Groveport, OH 43125
Estimated Value: $204,000 - $219,000
3
Beds
1
Bath
1,018
Sq Ft
$208/Sq Ft
Est. Value
About This Home
This home is located at 438 Benson Dr, Groveport, OH 43125 and is currently estimated at $212,141, approximately $208 per square foot. 438 Benson Dr is a home located in Franklin County with nearby schools including Groveport Madison High School, Groveport Community School, and Madison Christian School.
Ownership History
Date
Name
Owned For
Owner Type
Purchase Details
Closed on
Oct 11, 2022
Sold by
Watson James R and Watson Lisa A
Bought by
Watson Family Trust and Watson
Current Estimated Value
Purchase Details
Closed on
Jun 2, 1999
Sold by
Rowell Dewey C and Rowell Lora L
Bought by
Watson James R and Watson Lisa A
Home Financials for this Owner
Home Financials are based on the most recent Mortgage that was taken out on this home.
Original Mortgage
$68,464
Interest Rate
6.94%
Mortgage Type
FHA
Purchase Details
Closed on
May 30, 1991
Bought by
Rowell Dewey C and Rowell Lora L
Purchase Details
Closed on
Aug 11, 1988
Create a Home Valuation Report for This Property
The Home Valuation Report is an in-depth analysis detailing your home's value as well as a comparison with similar homes in the area
Home Values in the Area
Average Home Value in this Area
Purchase History
| Date | Buyer | Sale Price | Title Company |
|---|---|---|---|
| Watson Family Trust | -- | None Listed On Document | |
| Watson James R | $68,500 | Title First Agency Inc | |
| Rowell Dewey C | $56,500 | -- | |
| -- | $47,000 | -- |
Source: Public Records
Mortgage History
| Date | Status | Borrower | Loan Amount |
|---|---|---|---|
| Previous Owner | Watson James R | $68,464 |
Source: Public Records
Tax History Compared to Growth
Tax History
| Year | Tax Paid | Tax Assessment Tax Assessment Total Assessment is a certain percentage of the fair market value that is determined by local assessors to be the total taxable value of land and additions on the property. | Land | Improvement |
|---|---|---|---|---|
| 2024 | $2,730 | $55,830 | $19,710 | $36,120 |
| 2023 | $2,706 | $55,825 | $19,705 | $36,120 |
| 2022 | $1,955 | $32,170 | $8,120 | $24,050 |
| 2021 | $1,962 | $32,170 | $8,120 | $24,050 |
| 2020 | $1,967 | $32,170 | $8,120 | $24,050 |
| 2019 | $1,872 | $26,990 | $6,760 | $20,230 |
| 2018 | $1,972 | $26,990 | $6,760 | $20,230 |
| 2017 | $1,886 | $26,990 | $6,760 | $20,230 |
| 2016 | $2,045 | $26,570 | $6,510 | $20,060 |
| 2015 | $2,063 | $26,570 | $6,510 | $20,060 |
| 2014 | $1,942 | $26,570 | $6,510 | $20,060 |
| 2013 | $871 | $27,965 | $6,860 | $21,105 |
Source: Public Records
Map
Nearby Homes