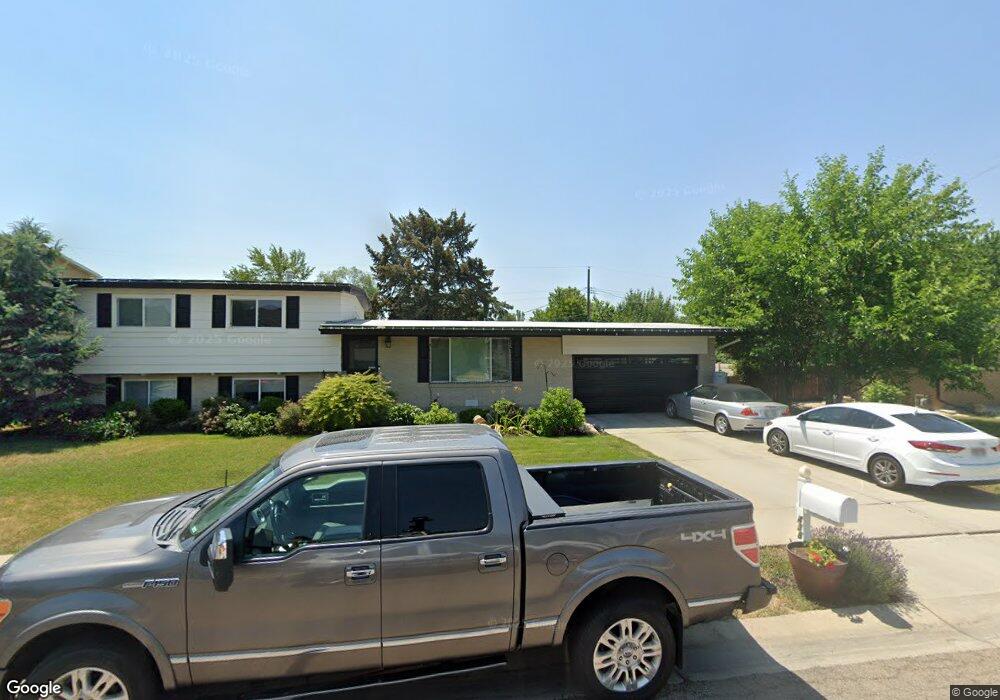
438 E Bridlewood Dr Salt Lake City, UT 84107
Estimated Value: $559,000 - $608,000
4
Beds
3
Baths
1,970
Sq Ft
$294/Sq Ft
Est. Value
About This Home
This home is located at 438 E Bridlewood Dr, Salt Lake City, UT 84107 and is currently estimated at $579,801, approximately $294 per square foot. 438 E Bridlewood Dr is a home located in Salt Lake County with nearby schools including James E Moss Elementary School, Bonneville Junior High School, and Cottonwood High School.
Ownership History
Date
Name
Owned For
Owner Type
Purchase Details
Closed on
Sep 6, 2016
Sold by
Leavit Joshua and Leavit Erika
Bought by
Whipple Mary Jane
Current Estimated Value
Home Financials for this Owner
Home Financials are based on the most recent Mortgage that was taken out on this home.
Original Mortgage
$231,120
Outstanding Balance
$184,728
Interest Rate
3.45%
Mortgage Type
New Conventional
Estimated Equity
$395,073
Purchase Details
Closed on
May 26, 2016
Sold by
Roberts Eleni Maria
Bought by
Leavitt Joshua and Leavitt Erika
Home Financials for this Owner
Home Financials are based on the most recent Mortgage that was taken out on this home.
Original Mortgage
$176,000
Interest Rate
3.58%
Mortgage Type
New Conventional
Purchase Details
Closed on
Mar 31, 1999
Sold by
Zolintakis Helen S
Bought by
Helen S Zolintakis Family Living Trust
Create a Home Valuation Report for This Property
The Home Valuation Report is an in-depth analysis detailing your home's value as well as a comparison with similar homes in the area
Home Values in the Area
Average Home Value in this Area
Purchase History
| Date | Buyer | Sale Price | Title Company |
|---|---|---|---|
| Whipple Mary Jane | -- | Backman Title Services | |
| Leavitt Joshua | -- | Backman Title Services | |
| Helen S Zolintakis Family Living Trust | -- | -- |
Source: Public Records
Mortgage History
| Date | Status | Borrower | Loan Amount |
|---|---|---|---|
| Open | Whipple Mary Jane | $231,120 | |
| Previous Owner | Leavitt Joshua | $176,000 |
Source: Public Records
Tax History Compared to Growth
Tax History
| Year | Tax Paid | Tax Assessment Tax Assessment Total Assessment is a certain percentage of the fair market value that is determined by local assessors to be the total taxable value of land and additions on the property. | Land | Improvement |
|---|---|---|---|---|
| 2025 | $3,060 | $510,100 | $174,800 | $335,300 |
| 2024 | $3,060 | $461,400 | $165,500 | $295,900 |
| 2023 | $3,299 | $495,500 | $159,100 | $336,400 |
| 2022 | $3,279 | $482,400 | $156,000 | $326,400 |
| 2021 | $2,441 | $320,100 | $121,200 | $198,900 |
| 2020 | $2,288 | $283,600 | $108,200 | $175,400 |
| 2019 | $2,430 | $283,900 | $98,500 | $185,400 |
| 2018 | $2,576 | $300,200 | $98,500 | $201,700 |
| 2017 | $2,492 | $295,900 | $98,500 | $197,400 |
| 2016 | $1,650 | $203,500 | $82,800 | $120,700 |
| 2015 | $1,615 | $186,400 | $83,600 | $102,800 |
| 2014 | -- | $167,600 | $77,800 | $89,800 |
Source: Public Records
Map
Nearby Homes
- 463 Doreen St
- 4475 S 500 E Unit 3
- 4463 S 500 E Unit 50
- 495 E Mary Rose Dr
- 4325 S Park St E
- 296 E Nashua St Unit 112
- 4520 S Julep Dr
- 333 E 4500 S Unit 9
- 333 E 4500 S Unit 13
- 4479 S 500 E Unit 67
- 4479 S 500 E Unit 1
- 4264 S Steele Creek Ct
- 4247 S 615 E
- 235 E Biltmore Ave Unit 460
- 500 E Julep Dr
- 227 Detroiter Cir
- 4178 S 650 E
- 4401 S 700 E
- 4364 S Detroiter Cir
- 689 E 4149 S
- 438 Bridlewood Dr
- 448 Bridlewood Dr
- 428 Bridlewood Dr
- 428 E Bridlewood Dr
- 439 Willow Ave
- 449 Willow Ave
- 429 Willow Ave
- 439 Bridlewood Dr
- 431 E Bridlewood Dr
- 431 Bridlewood Dr
- 4368 Larkwood St
- 4368 S Larkwood St
- 420 Bridlewood Dr
- 447 E Bridlewood Dr
- 447 Bridlewood Dr
- 4380 Larkwood St
- 421 Willow Ave
- 421 E Willow Ave
- 423 Bridlewood Dr
- 455 Bridlewood Dr