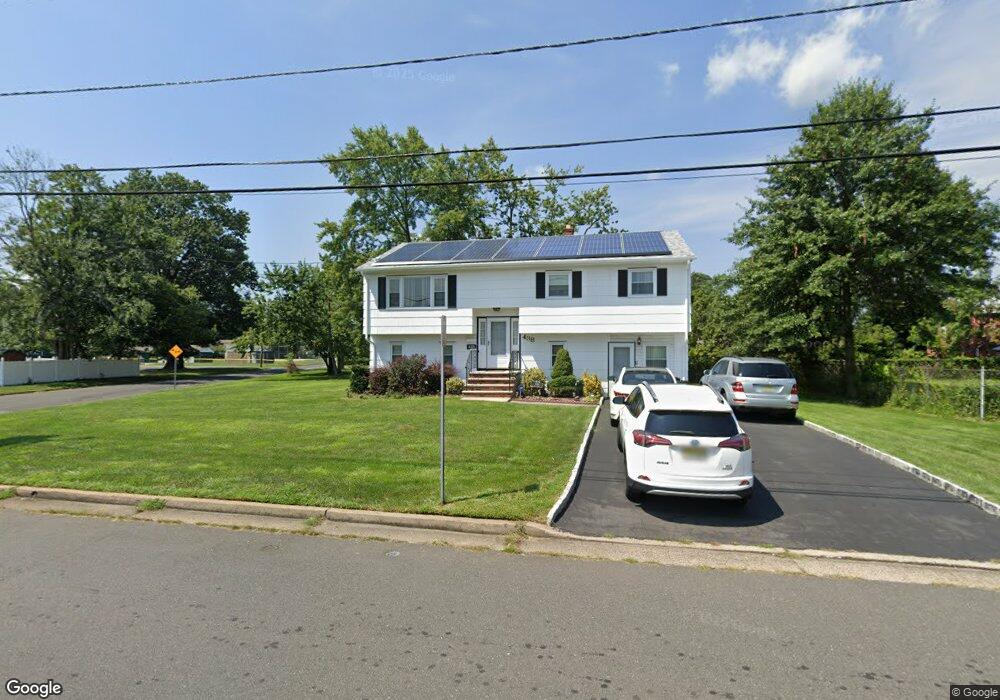
438 Pitt St South Plainfield, NJ 07080
Estimated Value: $604,000 - $666,000
--
Bed
--
Bath
2,172
Sq Ft
$292/Sq Ft
Est. Value
About This Home
This home is located at 438 Pitt St, South Plainfield, NJ 07080 and is currently estimated at $633,800, approximately $291 per square foot. 438 Pitt St is a home located in Middlesex County with nearby schools including South Plainfield High School, Holy Savior Academy, and Koinonia Academy.
Ownership History
Date
Name
Owned For
Owner Type
Purchase Details
Closed on
Sep 14, 2022
Sold by
Dennis Yede B
Bought by
Jeannot Andre J and Jeannot Manisha
Current Estimated Value
Home Financials for this Owner
Home Financials are based on the most recent Mortgage that was taken out on this home.
Original Mortgage
$458,383
Outstanding Balance
$437,826
Interest Rate
5.22%
Mortgage Type
FHA
Estimated Equity
$195,974
Create a Home Valuation Report for This Property
The Home Valuation Report is an in-depth analysis detailing your home's value as well as a comparison with similar homes in the area
Home Values in the Area
Average Home Value in this Area
Purchase History
| Date | Buyer | Sale Price | Title Company |
|---|---|---|---|
| Jeannot Andre J | $470,000 | -- | |
| Jeannot Andre J | $470,000 | None Listed On Document |
Source: Public Records
Mortgage History
| Date | Status | Borrower | Loan Amount |
|---|---|---|---|
| Open | Jeannot Andre J | $458,383 | |
| Closed | Jeannot Andre J | $458,383 |
Source: Public Records
Tax History Compared to Growth
Tax History
| Year | Tax Paid | Tax Assessment Tax Assessment Total Assessment is a certain percentage of the fair market value that is determined by local assessors to be the total taxable value of land and additions on the property. | Land | Improvement |
|---|---|---|---|---|
| 2025 | $8,330 | $119,300 | $34,700 | $84,600 |
| 2024 | $7,967 | $119,300 | $34,700 | $84,600 |
| 2023 | $7,967 | $119,300 | $34,700 | $84,600 |
| 2022 | $7,868 | $119,300 | $34,700 | $84,600 |
| 2021 | $7,683 | $119,300 | $34,700 | $84,600 |
| 2020 | $7,571 | $119,300 | $34,700 | $84,600 |
| 2019 | $7,264 | $119,300 | $34,700 | $84,600 |
| 2018 | $7,077 | $119,300 | $34,700 | $84,600 |
| 2017 | $6,986 | $119,300 | $34,700 | $84,600 |
| 2016 | $6,916 | $119,300 | $34,700 | $84,600 |
| 2015 | $6,797 | $119,300 | $34,700 | $84,600 |
| 2014 | $6,601 | $119,300 | $34,700 | $84,600 |
Source: Public Records
Map
Nearby Homes