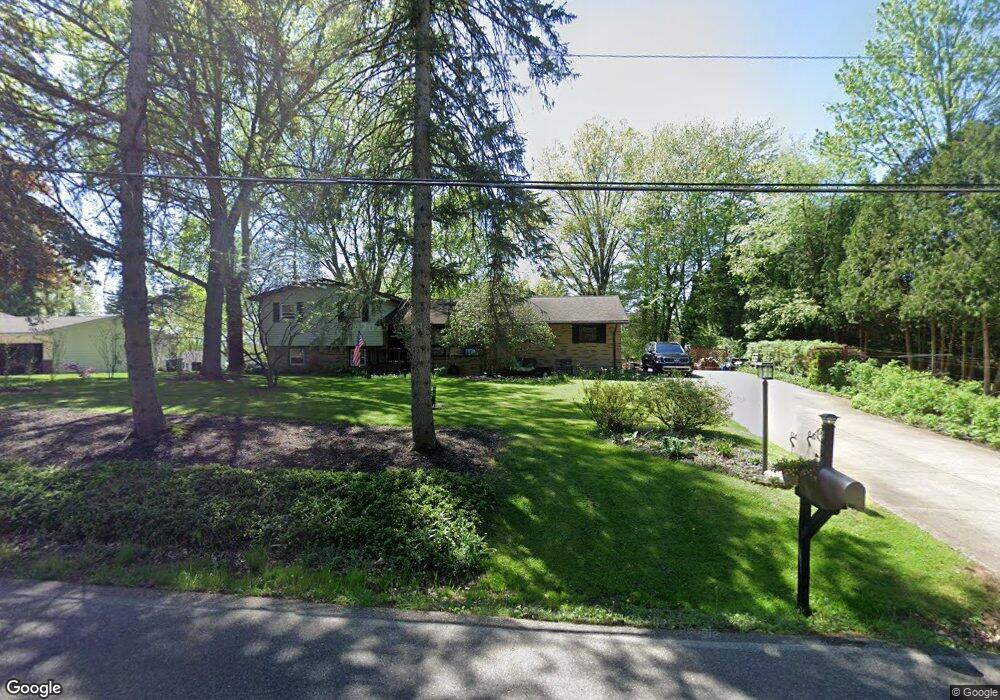
439 Crestmont Ave SW Hartville, OH 44632
Estimated Value: $186,000 - $273,000
3
Beds
2
Baths
1,573
Sq Ft
$148/Sq Ft
Est. Value
About This Home
This home is located at 439 Crestmont Ave SW, Hartville, OH 44632 and is currently estimated at $233,207, approximately $148 per square foot. 439 Crestmont Ave SW is a home located in Stark County with nearby schools including Lake Middle/High School and Lake Center Christian School.
Ownership History
Date
Name
Owned For
Owner Type
Purchase Details
Closed on
May 18, 2011
Sold by
Federal Home Loan Mortgage Corporation
Bought by
Davis Jeffrey J and Davis Mary E
Current Estimated Value
Home Financials for this Owner
Home Financials are based on the most recent Mortgage that was taken out on this home.
Original Mortgage
$80,895
Interest Rate
4.63%
Mortgage Type
FHA
Purchase Details
Closed on
Feb 10, 2011
Sold by
Bassett Robert D
Bought by
Federal Home Loan Mortgage Corp
Purchase Details
Closed on
Apr 26, 2005
Sold by
Iborra Jose Antonio
Bought by
Bassett Robert Douglas and Bassett Michele
Home Financials for this Owner
Home Financials are based on the most recent Mortgage that was taken out on this home.
Original Mortgage
$114,950
Interest Rate
8.1%
Mortgage Type
Fannie Mae Freddie Mac
Create a Home Valuation Report for This Property
The Home Valuation Report is an in-depth analysis detailing your home's value as well as a comparison with similar homes in the area
Home Values in the Area
Average Home Value in this Area
Purchase History
| Date | Buyer | Sale Price | Title Company |
|---|---|---|---|
| Davis Jeffrey J | $83,000 | Attorney | |
| Federal Home Loan Mortgage Corp | $90,000 | None Available | |
| Bassett Robert Douglas | $121,000 | -- |
Source: Public Records
Mortgage History
| Date | Status | Borrower | Loan Amount |
|---|---|---|---|
| Previous Owner | Davis Jeffrey J | $80,895 | |
| Previous Owner | Bassett Robert Douglas | $114,950 |
Source: Public Records
Tax History Compared to Growth
Tax History
| Year | Tax Paid | Tax Assessment Tax Assessment Total Assessment is a certain percentage of the fair market value that is determined by local assessors to be the total taxable value of land and additions on the property. | Land | Improvement |
|---|---|---|---|---|
| 2025 | -- | $64,760 | $30,630 | $34,130 |
| 2024 | -- | $64,760 | $30,630 | $34,130 |
| 2023 | $2,528 | $47,010 | $18,340 | $28,670 |
| 2022 | $2,536 | $47,010 | $18,340 | $28,670 |
| 2021 | $2,562 | $47,010 | $18,340 | $28,670 |
| 2020 | $2,567 | $41,370 | $15,400 | $25,970 |
| 2019 | $2,921 | $41,370 | $15,400 | $25,970 |
| 2018 | $2,506 | $41,370 | $15,400 | $25,970 |
| 2017 | $2,403 | $36,130 | $11,800 | $24,330 |
| 2016 | $2,397 | $35,920 | $11,800 | $24,120 |
| 2015 | $2,395 | $35,920 | $11,800 | $24,120 |
| 2014 | $195 | $33,080 | $10,850 | $22,230 |
| 2013 | $1,098 | $33,080 | $10,850 | $22,230 |
Source: Public Records
Map
Nearby Homes
- Unit 9 Meadow Trail SW Unit 9
- 510 Meadow Cir SW Unit 11
- 550 Woodlands Glen Ave
- 525 Gentlebrook Blvd SW
- 778 Fair Vista Cir SW
- 786 Fair Vista Cir SW
- 531 Gentlebrook Blvd SW
- 747 Grandview Cir
- 11900 Geib Ave NE
- 330 Belle Ave SW
- 225 Seneca Trail SW
- 316 S Prospect Ave
- 335 W Maple St
- 425 Tonawanda Trail SW
- 215 Lake Ave NE
- 12725 Bixler Ave NE
- 203 N Prospect Ave
- 223 E Maple St
- 142 Relentless Way
- 138 Relentless Way
- 423 Crestmont Ave SW
- 451 Crestmont Ave SW
- 665 Lynnview St SW
- 463 Crestmont Ave SW
- 668 Lynnview St SW
- 473 Crestmont Ave SW
- 653 Lynnview St SW
- Unit 27 Meadow Trail SW Unit 27
- 430 Meadow Trail SW Unit 26
- 656 Lynnview St SW
- 434 Meadow Trail SW
- 485 Crestmont Ave SW
- 657 Billman St SW
- 643 Lynnview St SW
- 644 Lynnview St SW
- 655 Billman St SW
- 495 Crestmont Ave SW
- 478 Meadow Trail SW
- 631 Lynnview St SW
- 509 Meadow Cir Unit 11