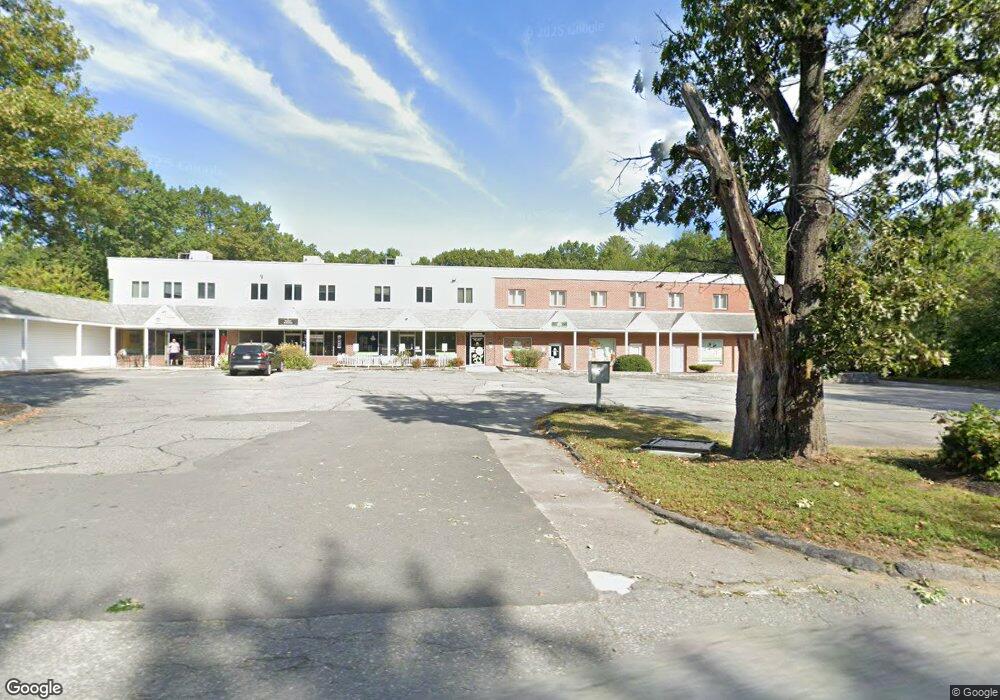
439 Littleton Rd Unit 2 Westford, MA 01886
Estimated Value: $3,051,850
--
Bed
--
Bath
17,909
Sq Ft
$170/Sq Ft
Est. Value
About This Home
This home is located at 439 Littleton Rd Unit 2, Westford, MA 01886 and is currently estimated at $3,051,850, approximately $170 per square foot. 439 Littleton Rd Unit 2 is a home located in Middlesex County with nearby schools including Col John Robinson, John A. Crisafulli Elementary School, and Blanchard Middle School.
Ownership History
Date
Name
Owned For
Owner Type
Purchase Details
Closed on
Nov 20, 2015
Sold by
Pav Llc
Bought by
Pace Energy Corp
Current Estimated Value
Home Financials for this Owner
Home Financials are based on the most recent Mortgage that was taken out on this home.
Original Mortgage
$1,200,000
Outstanding Balance
$943,858
Interest Rate
3.79%
Mortgage Type
Commercial
Estimated Equity
$2,107,992
Purchase Details
Closed on
May 27, 1997
Sold by
Greenwood Trust Iii and Tanden Shilpi
Bought by
Pav Llc
Purchase Details
Closed on
Oct 4, 1993
Sold by
Fdic
Bought by
Greenwood T 3 and Cusanelli Debra A
Purchase Details
Closed on
May 7, 1991
Sold by
Carlin Rt
Bought by
Bk Five For Savs
Purchase Details
Closed on
May 3, 1991
Sold by
Carlin Rt
Bought by
Bank Five For Svgs
Create a Home Valuation Report for This Property
The Home Valuation Report is an in-depth analysis detailing your home's value as well as a comparison with similar homes in the area
Home Values in the Area
Average Home Value in this Area
Purchase History
| Date | Buyer | Sale Price | Title Company |
|---|---|---|---|
| Pace Energy Corp | $1,600,000 | -- | |
| Pace Energy Corp | $1,600,000 | -- | |
| Pav Llc | $1,027,000 | -- | |
| Pav Llc | $1,027,000 | -- | |
| Pav Llc | $1,027,000 | -- | |
| Greenwood T 3 | $500,000 | -- | |
| Greenwood T 3 | $500,000 | -- | |
| Bk Five For Savs | $872,000 | -- | |
| Bk Five For Savs | $872,000 | -- | |
| Bank Five For Svgs | $872,000 | -- | |
| Bank Five For Svgs | $872,000 | -- |
Source: Public Records
Mortgage History
| Date | Status | Borrower | Loan Amount |
|---|---|---|---|
| Open | Pace Energy Corp | $1,200,000 | |
| Closed | Pace Energy Corp | $1,200,000 |
Source: Public Records
Tax History Compared to Growth
Tax History
| Year | Tax Paid | Tax Assessment Tax Assessment Total Assessment is a certain percentage of the fair market value that is determined by local assessors to be the total taxable value of land and additions on the property. | Land | Improvement |
|---|---|---|---|---|
| 2025 | $20,798 | $1,544,000 | $542,200 | $1,001,800 |
| 2024 | $20,851 | $1,514,200 | $542,200 | $972,000 |
| 2023 | $22,688 | $1,537,100 | $542,200 | $994,900 |
| 2022 | $21,706 | $1,346,500 | $493,800 | $852,700 |
| 2021 | $22,238 | $1,336,400 | $493,800 | $842,600 |
| 2020 | $21,459 | $1,314,100 | $493,800 | $820,300 |
| 2019 | $2,265 | $1,338,400 | $493,800 | $844,600 |
| 2018 | $21,923 | $1,338,400 | $493,800 | $844,600 |
| 2017 | $22,422 | $1,349,900 | $493,800 | $856,100 |
| 2016 | $19,706 | $1,194,300 | $336,400 | $857,900 |
| 2015 | $18,028 | $1,096,600 | $301,500 | $795,100 |
| 2014 | $19,905 | $1,182,700 | $294,500 | $888,200 |
Source: Public Records
Map
Nearby Homes
- 55 Jennifer St
- 12 Paula Beth St
- 115 Goldsmith St
- 10 Baldwin Hill Rd
- 34 Baldwin Hill Rd
- 8 Edsel Rd
- 4 Mars Place
- 125 Concord Rd
- 336 King St Unit 105
- 16 Fletcher Ln
- 91 Jimney Dr Unit 91
- 92 Jimney Dr
- 5 Mill Park Place
- 5 Mill Park Place Unit 5
- 3 Mill Park Place
- 3 Mill Park Place Unit 3
- 28 Monadnock Dr
- 18 Long Lake Rd
- 41 Flagg Rd
- 17 Hartwell Ave
- 439 Littleton Rd
- 437 Littleton Rd
- 432 Littleton Rd
- 434 Littleton Rd
- 434 Littleton Rd
- 434 Littleton Rd
- 434 Littleton Rd Unit 8
- 434 Littleton Rd Unit 7 & 8
- 434 Littleton Rd Unit 1-6
- 434 Littleton Rd Unit 4
- 434 Littleton Rd Unit 3B
- 434 Littleton Rd Unit 3A
- 434 Littleton Rd Unit 1&2
- 434 Littleton Rd Unit S
- 434 Littleton Rd Unit 1-8
- 434 Littleton Rd Unit 7
- 434 Littleton Rd Unit 5
- 434 Littleton Rd Unit 2
- 434 Littleton Rd Unit 3
- 434 Littleton Rd Unit 6