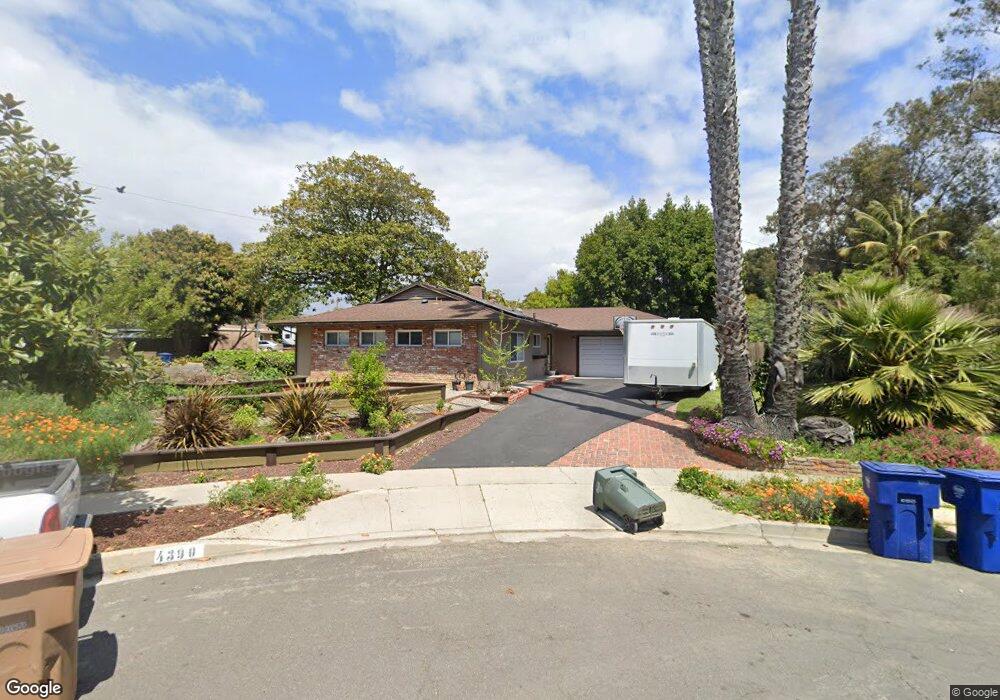
4390 Whittier Ct Ventura, CA 93003
College NeighborhoodEstimated Value: $911,000 - $1,080,000
3
Beds
2
Baths
1,410
Sq Ft
$697/Sq Ft
Est. Value
About This Home
This home is located at 4390 Whittier Ct, Ventura, CA 93003 and is currently estimated at $982,746, approximately $696 per square foot. 4390 Whittier Ct is a home located in Ventura County with nearby schools including Elmhurst Elementary School, Anacapa Middle School, and Buena High School.
Ownership History
Date
Name
Owned For
Owner Type
Purchase Details
Closed on
Feb 10, 2012
Sold by
The Bank Of New York Mellon
Bought by
Mitchell Edward J and Mitchell Tobie E
Current Estimated Value
Home Financials for this Owner
Home Financials are based on the most recent Mortgage that was taken out on this home.
Original Mortgage
$355,747
Interest Rate
4.25%
Mortgage Type
FHA
Purchase Details
Closed on
Aug 31, 2011
Sold by
Marshall Jayne V
Bought by
The Bank Of New York Mellon
Purchase Details
Closed on
Feb 15, 2005
Sold by
Thompson William E and Thompson Kay B
Bought by
Marshall Jayne
Home Financials for this Owner
Home Financials are based on the most recent Mortgage that was taken out on this home.
Original Mortgage
$479,200
Interest Rate
5.87%
Mortgage Type
FHA
Purchase Details
Closed on
Nov 29, 2000
Sold by
Thompson William E and Thompson Kay B
Bought by
Thompson William E and Thompson Kay B
Create a Home Valuation Report for This Property
The Home Valuation Report is an in-depth analysis detailing your home's value as well as a comparison with similar homes in the area
Home Values in the Area
Average Home Value in this Area
Purchase History
| Date | Buyer | Sale Price | Title Company |
|---|---|---|---|
| Mitchell Edward J | $365,000 | Landsafe Title | |
| The Bank Of New York Mellon | $337,500 | Landsafe Title | |
| Marshall Jayne | $599,000 | Ticor Title Company Of Ca | |
| Thompson William E | -- | -- |
Source: Public Records
Mortgage History
| Date | Status | Borrower | Loan Amount |
|---|---|---|---|
| Previous Owner | Mitchell Edward J | $355,747 | |
| Previous Owner | Marshall Jayne | $479,200 | |
| Closed | Marshall Jayne | $59,900 |
Source: Public Records
Tax History Compared to Growth
Tax History
| Year | Tax Paid | Tax Assessment Tax Assessment Total Assessment is a certain percentage of the fair market value that is determined by local assessors to be the total taxable value of land and additions on the property. | Land | Improvement |
|---|---|---|---|---|
| 2025 | $4,920 | $458,447 | $229,224 | $229,223 |
| 2024 | $4,920 | $449,458 | $224,729 | $224,729 |
| 2023 | $4,864 | $440,646 | $220,323 | $220,323 |
| 2022 | $4,523 | $432,006 | $216,003 | $216,003 |
| 2021 | $4,445 | $423,536 | $211,768 | $211,768 |
| 2020 | $4,404 | $419,196 | $209,598 | $209,598 |
| 2019 | $4,323 | $410,978 | $205,489 | $205,489 |
| 2018 | $4,251 | $402,920 | $201,460 | $201,460 |
| 2017 | $4,172 | $395,020 | $197,510 | $197,510 |
| 2016 | $4,099 | $387,276 | $193,638 | $193,638 |
| 2015 | $4,033 | $381,460 | $190,730 | $190,730 |
| 2014 | $3,975 | $373,990 | $186,995 | $186,995 |
Source: Public Records
Map
Nearby Homes
- 4432 Westmont St
- 4700 Aurora Dr Unit 16
- 4700 Aurora Dr Unit 75
- 4700 Aurora Dr Unit 29
- 36 Copland Cir
- 75 Copland Cir Unit 75
- 4499 Copland Dr Unit 51
- 79 Copland Cir Unit 79
- 80 Copland Cir
- 501 Redwood Ave
- 3975 Telegraph Rd Unit 5
- 3700 Dean Dr Unit 1101
- 3700 Dean Dr Unit 2106
- 3700 Dean Dr Unit 302
- 3700 Dean Dr Unit 1207
- 4797 Loma Vista Rd
- 24 Debussy Ln Unit 24
- 311 Rodgers St Unit 311
- 4857 Loma Vista Rd
- 1099 Purcell Ln