44 Mackeral Dr Hattiesburg, MS 39402
Estimated Value: $273,240 - $335,000
--
Bed
--
Bath
1,590
Sq Ft
$188/Sq Ft
Est. Value
About This Home
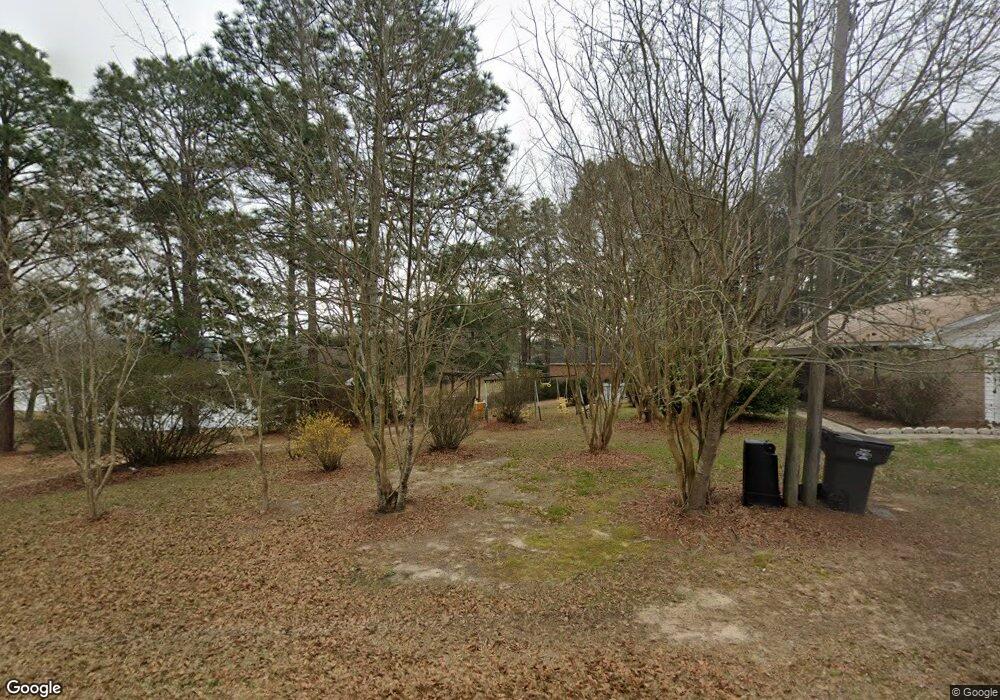
This home is located at 44 Mackeral Dr, Hattiesburg, MS 39402 and is currently estimated at $298,560, approximately $187 per square foot. 44 Mackeral Dr is a home located in Lamar County with nearby schools including Longleaf Elementary School, Oak Grove Middle School, and Oak Grove High School.
Ownership History
Date
Name
Owned For
Owner Type
Purchase Details
Closed on
Apr 1, 2015
Sold by
Wendel Alfred E and Wendel Cook
Bought by
Cook Janis E
Current Estimated Value
Home Financials for this Owner
Home Financials are based on the most recent Mortgage that was taken out on this home.
Original Mortgage
$159,000
Outstanding Balance
$122,493
Interest Rate
3.84%
Mortgage Type
Unknown
Estimated Equity
$176,067
Purchase Details
Closed on
Nov 30, 2010
Sold by
Wendel Alfred E and Wendel Nancy L
Bought by
Wendel Alfred E and Wendel Nancy L
Create a Home Valuation Report for This Property
The Home Valuation Report is an in-depth analysis detailing your home's value as well as a comparison with similar homes in the area
Home Values in the Area
Average Home Value in this Area
Purchase History
| Date | Buyer | Sale Price | Title Company |
|---|---|---|---|
| Cook Janis E | $179,000 | -- | |
| Cook Janis E | $179,000 | -- | |
| Wendel Alfred E | -- | -- |
Source: Public Records
Mortgage History
| Date | Status | Borrower | Loan Amount |
|---|---|---|---|
| Open | Cook Janis E | $159,000 | |
| Closed | Cook Janis E | $159,000 |
Source: Public Records
Tax History Compared to Growth
Tax History
| Year | Tax Paid | Tax Assessment Tax Assessment Total Assessment is a certain percentage of the fair market value that is determined by local assessors to be the total taxable value of land and additions on the property. | Land | Improvement |
|---|---|---|---|---|
| 2025 | $2,324 | $18,487 | $0 | $0 |
| 2024 | $2,324 | $18,487 | $0 | $0 |
| 2023 | $2,324 | $18,487 | $0 | $0 |
| 2022 | $1,783 | $16,570 | $0 | $0 |
| 2021 | $1,636 | $15,590 | $0 | $0 |
| 2020 | $1,636 | $15,590 | $0 | $0 |
| 2019 | $1,636 | $15,590 | $0 | $0 |
| 2018 | $1,568 | $15,043 | $0 | $0 |
| 2017 | $1,885 | $15,180 | $0 | $0 |
| 2015 | $2,623 | $21,124 | $0 | $0 |
| 2014 | -- | $14,001 | $0 | $0 |
| 2013 | -- | $14,135 | $0 | $0 |
Source: Public Records
Map
Nearby Homes