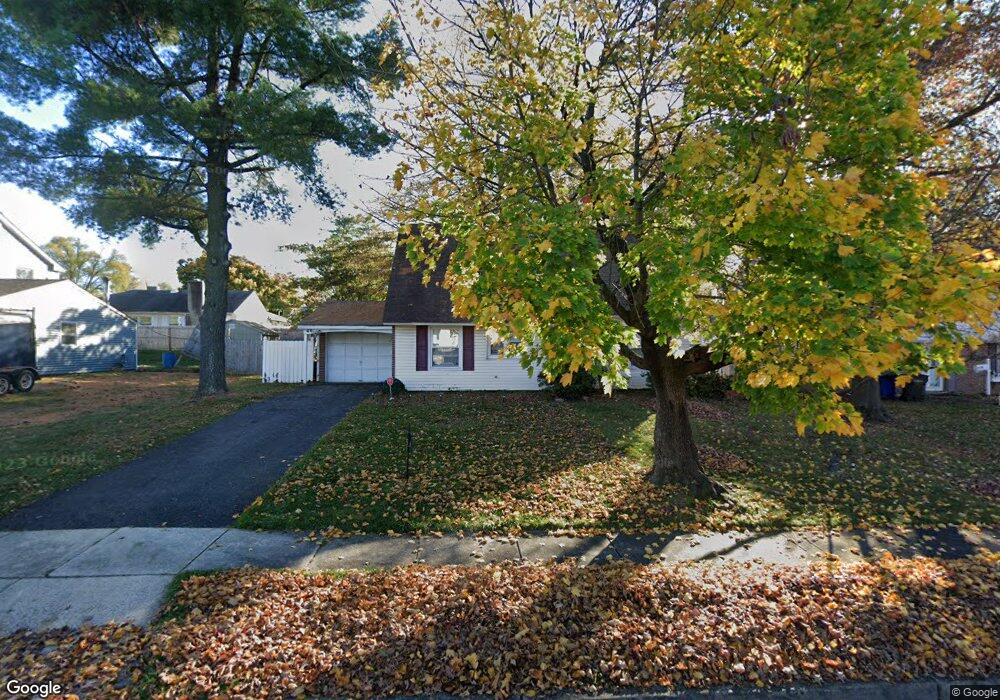
44 Parson Ln Willingboro, NJ 08046
Estimated Value: $293,000 - $376,000
--
Bed
--
Bath
1,372
Sq Ft
$244/Sq Ft
Est. Value
About This Home
This home is located at 44 Parson Ln, Willingboro, NJ 08046 and is currently estimated at $335,187, approximately $244 per square foot. 44 Parson Ln is a home located in Burlington County with nearby schools including W.R. James Sr. Elementary School, Levitt Intermediate School, and Memorial Middle School.
Ownership History
Date
Name
Owned For
Owner Type
Purchase Details
Closed on
Feb 18, 2003
Sold by
Dobisch Ronald and Dobisch Susan Carla
Bought by
New Jersey Home Construction Inc
Current Estimated Value
Purchase Details
Closed on
Jun 25, 2002
Sold by
New Jersey Home Construction Inc
Bought by
Floyd Stuart D
Home Financials for this Owner
Home Financials are based on the most recent Mortgage that was taken out on this home.
Original Mortgage
$114,150
Interest Rate
5.34%
Mortgage Type
FHA
Create a Home Valuation Report for This Property
The Home Valuation Report is an in-depth analysis detailing your home's value as well as a comparison with similar homes in the area
Home Values in the Area
Average Home Value in this Area
Purchase History
| Date | Buyer | Sale Price | Title Company |
|---|---|---|---|
| New Jersey Home Construction Inc | $63,600 | -- | |
| Floyd Stuart D | $119,000 | Congress Title Corp |
Source: Public Records
Mortgage History
| Date | Status | Borrower | Loan Amount |
|---|---|---|---|
| Previous Owner | Floyd Stuart D | $114,150 |
Source: Public Records
Tax History Compared to Growth
Tax History
| Year | Tax Paid | Tax Assessment Tax Assessment Total Assessment is a certain percentage of the fair market value that is determined by local assessors to be the total taxable value of land and additions on the property. | Land | Improvement |
|---|---|---|---|---|
| 2025 | $5,077 | $117,600 | $33,400 | $84,200 |
| 2024 | $5,039 | $117,600 | $33,400 | $84,200 |
| 2023 | $5,039 | $117,600 | $33,400 | $84,200 |
| 2022 | $4,691 | $117,600 | $33,400 | $84,200 |
| 2021 | $4,274 | $117,600 | $33,400 | $84,200 |
| 2020 | $4,719 | $117,600 | $33,400 | $84,200 |
| 2019 | $4,675 | $117,600 | $33,400 | $84,200 |
| 2018 | $4,588 | $117,600 | $33,400 | $84,200 |
| 2017 | $4,459 | $117,600 | $33,400 | $84,200 |
| 2016 | $4,415 | $117,600 | $33,400 | $84,200 |
| 2015 | $4,263 | $117,600 | $33,400 | $84,200 |
| 2014 | $4,058 | $117,600 | $33,400 | $84,200 |
Source: Public Records
Map
Nearby Homes