4401 Quail Hollow Dr Raleigh, NC 27609
North Hills NeighborhoodEstimated Value: $656,755 - $795,000
4
Beds
3
Baths
2,208
Sq Ft
$321/Sq Ft
Est. Value
About This Home
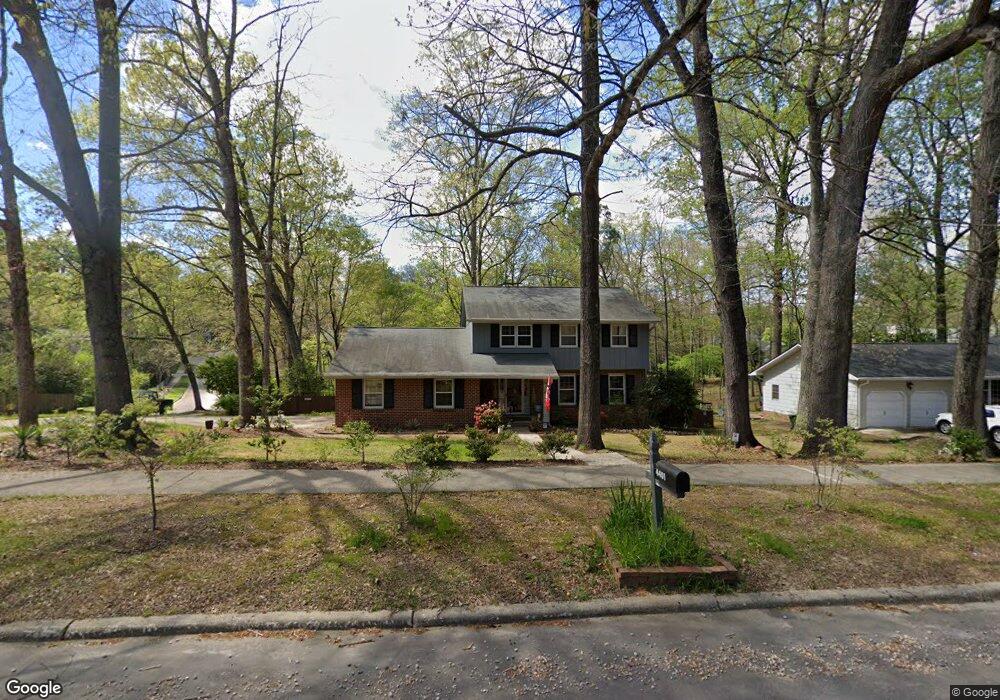
This home is located at 4401 Quail Hollow Dr, Raleigh, NC 27609 and is currently estimated at $709,189, approximately $321 per square foot. 4401 Quail Hollow Dr is a home located in Wake County with nearby schools including Douglas Elementary, Carroll Middle, and Sanderson High School.
Ownership History
Date
Name
Owned For
Owner Type
Purchase Details
Closed on
Oct 22, 2019
Sold by
Loziuk Philip L and Loziuk Julie B
Bought by
Loziuk Phillip L and Loziuk Julie B
Current Estimated Value
Home Financials for this Owner
Home Financials are based on the most recent Mortgage that was taken out on this home.
Original Mortgage
$180,706
Outstanding Balance
$158,308
Interest Rate
3.5%
Mortgage Type
New Conventional
Estimated Equity
$550,881
Purchase Details
Closed on
May 31, 2016
Sold by
Marshall Lawrence J and Marshall Linda C
Bought by
Loziuk Plhillip L and Chytka Julie B
Home Financials for this Owner
Home Financials are based on the most recent Mortgage that was taken out on this home.
Original Mortgage
$303,600
Interest Rate
3.58%
Mortgage Type
New Conventional
Purchase Details
Closed on
Feb 29, 1984
Bought by
Marshall Lawrence J and Marshall Linda C
Create a Home Valuation Report for This Property
The Home Valuation Report is an in-depth analysis detailing your home's value as well as a comparison with similar homes in the area
Home Values in the Area
Average Home Value in this Area
Purchase History
| Date | Buyer | Sale Price | Title Company |
|---|---|---|---|
| Loziuk Phillip L | $500 | None Available | |
| Loziuk Philip L | -- | None Listed On Document | |
| Loziuk Plhillip L | $330,000 | None Available | |
| Marshall Lawrence J | $91,000 | -- |
Source: Public Records
Mortgage History
| Date | Status | Borrower | Loan Amount |
|---|---|---|---|
| Open | Loziuk Philip L | $180,706 | |
| Closed | Loziuk Philip L | $180,706 | |
| Previous Owner | Loziuk Plhillip L | $303,600 |
Source: Public Records
Tax History Compared to Growth
Tax History
| Year | Tax Paid | Tax Assessment Tax Assessment Total Assessment is a certain percentage of the fair market value that is determined by local assessors to be the total taxable value of land and additions on the property. | Land | Improvement |
|---|---|---|---|---|
| 2025 | $5,157 | $589,008 | $300,000 | $289,008 |
| 2024 | $5,136 | $589,008 | $300,000 | $289,008 |
| 2023 | $3,993 | $364,481 | $160,000 | $204,481 |
| 2022 | $3,710 | $364,481 | $160,000 | $204,481 |
| 2021 | $3,566 | $364,481 | $160,000 | $204,481 |
| 2020 | $3,528 | $367,251 | $160,000 | $207,251 |
| 2019 | $3,369 | $288,948 | $130,000 | $158,948 |
| 2018 | $3,177 | $288,948 | $130,000 | $158,948 |
| 2017 | $3,026 | $288,948 | $130,000 | $158,948 |
| 2016 | $2,964 | $288,948 | $130,000 | $158,948 |
| 2015 | $2,597 | $248,835 | $88,000 | $160,835 |
| 2014 | $2,463 | $248,835 | $88,000 | $160,835 |
Source: Public Records
Map
Nearby Homes
- 4716 Radcliff Rd
- 4005 Quail Hollow Dr
- 4500 Latimer Rd
- 4308 Windsor Place
- 4305 Windsor Place
- 405 Latimer Rd
- 4906 Tremont Dr
- 628 Sarah Lawrence Ct
- 4901 Baylor Ct
- 308 Latimer Rd
- 405 E Rowan St
- 4901 Stonehill Dr
- 301 Latimer Rd
- 4906 Lakemont Dr
- 5025 Quail Hollow Dr
- 4601 Pemberton Dr
- 4908 Lakemont Dr
- 601 Duke Dr
- 1204 Country Ridge Dr
- 4921 Sweetbriar Dr
- 4405 Quail Hollow Dr
- 805 Compton Rd
- 4313 Quail Hollow Dr
- 900 Langford Place
- 828 Faulkner Place
- 824 Faulkner Place
- 4404 Quail Hollow Dr
- 804 Compton Rd
- 4316 Quail Hollow Dr
- 820 Faulkner Place
- 4309 Quail Hollow Dr
- 904 Langford Place
- 801 Compton Rd
- 4312 Quail Hollow Dr
- 905 Langford Place
- 4216 Converse Dr
- 4305 Quail Hollow Dr
- 2041 Langford Ln
- 2040 Langford Ln
- 2045 Langford Ln