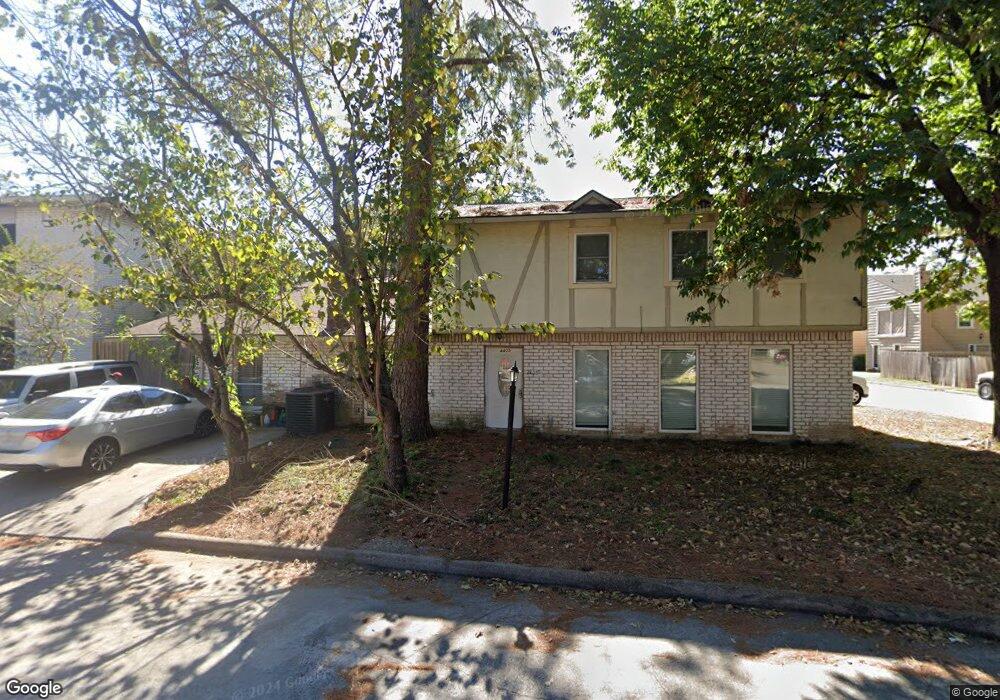
4405 W Cypress Villas Dr Spring, TX 77379
Champions NeighborhoodEstimated Value: $212,000 - $316,000
3
Beds
2
Baths
1,928
Sq Ft
$143/Sq Ft
Est. Value
About This Home
This home is located at 4405 W Cypress Villas Dr, Spring, TX 77379 and is currently estimated at $275,377, approximately $142 per square foot. 4405 W Cypress Villas Dr is a home located in Harris County with nearby schools including Benfer Elementary School, Strack Intermediate School, and Klein High School.
Ownership History
Date
Name
Owned For
Owner Type
Purchase Details
Closed on
May 27, 2025
Sold by
Perez Dennis
Bought by
Perez Dennis and Salazar Sandra
Current Estimated Value
Purchase Details
Closed on
Sep 1, 2015
Sold by
Secretary Of Hud Of Washington Dc
Bought by
Perez Dennis
Purchase Details
Closed on
May 14, 2014
Sold by
Beaty Carolyn E and Davidson Robert
Bought by
Bank Of America Na
Purchase Details
Closed on
May 8, 2014
Sold by
Bank Of America Na
Bought by
The Secretary Of Housing And Urban Deve
Purchase Details
Closed on
Aug 3, 2007
Sold by
Howard Philip L and Howard Sofia R
Bought by
Beaty Carolyn E and Davidson Robert
Home Financials for this Owner
Home Financials are based on the most recent Mortgage that was taken out on this home.
Original Mortgage
$138,902
Interest Rate
6.73%
Mortgage Type
Purchase Money Mortgage
Create a Home Valuation Report for This Property
The Home Valuation Report is an in-depth analysis detailing your home's value as well as a comparison with similar homes in the area
Home Values in the Area
Average Home Value in this Area
Purchase History
| Date | Buyer | Sale Price | Title Company |
|---|---|---|---|
| Perez Dennis | -- | None Listed On Document | |
| Perez Dennis | -- | None Available | |
| Bank Of America Na | $161,981 | Servicelink | |
| The Secretary Of Housing And Urban Deve | -- | None Available | |
| Beaty Carolyn E | -- | Greater Texas Title |
Source: Public Records
Mortgage History
| Date | Status | Borrower | Loan Amount |
|---|---|---|---|
| Previous Owner | Beaty Carolyn E | $138,902 |
Source: Public Records
Tax History Compared to Growth
Tax History
| Year | Tax Paid | Tax Assessment Tax Assessment Total Assessment is a certain percentage of the fair market value that is determined by local assessors to be the total taxable value of land and additions on the property. | Land | Improvement |
|---|---|---|---|---|
| 2025 | $5,951 | $260,905 | $46,224 | $214,681 |
| 2024 | $5,951 | $279,202 | $46,224 | $232,978 |
| 2023 | $5,951 | $308,207 | $46,224 | $261,983 |
| 2022 | $5,615 | $248,134 | $46,224 | $201,910 |
| 2021 | $4,184 | $173,298 | $24,653 | $148,645 |
| 2020 | $4,185 | $166,170 | $24,653 | $141,517 |
| 2019 | $4,351 | $166,170 | $24,653 | $141,517 |
| 2018 | $1,976 | $138,206 | $24,653 | $113,553 |
| 2017 | $3,399 | $129,598 | $24,653 | $104,945 |
| 2016 | $3,118 | $118,881 | $18,490 | $100,391 |
| 2015 | $2,805 | $102,954 | $18,490 | $84,464 |
| 2014 | $2,805 | $108,476 | $18,490 | $89,986 |
Source: Public Records
Map
Nearby Homes
- 17833 S Cypress Villas Dr
- 18023 Woodgum Dr
- 4826 Casemont Dr
- 4807 Coltwood Dr
- 18022 Blundell Dr
- 18011 Tall Cypress Dr
- 17910 W Strack Dr
- 4723 Lost Oak Dr
- 4223 Annawood Cir
- 17427 W Strack Dr
- 17910 Loring Ln
- 4070 Coltwood Dr
- 4034 Rolling Terrace Dr
- 4126 Oxhill Rd
- 4019 Fir Forest Dr
- 17618 Tall Cypress Dr
- 17623 Bent Cypress Dr
- 5202 Summerfield Ln
- 5206 Summerfield Ln
- 17903 Fireside Dr
- 17832 Cluster Ct
- 4425 W Cypress Villas Dr
- 17825 Cluster Ct
- 4427 W Cypress Villas Dr
- 17830 Cluster Ct
- 4410 W Cypress Villas Dr
- 4429 W Cypress Villas Dr
- 17819 Cluster Ct
- 4424 W Cypress Villas Dr
- 17817 Cluster Ct
- 17821 Cluster Ct
- 4447 W Cypress Villas Dr
- 17824 Cluster Ct
- 4432 W Cypress Villas Dr
- 4449 W Cypress Villas Dr
- 4422 W Cypress Villas Dr
- 17828 Cluster Ct
- 17815 Cluster Ct
- 17807 Cluster Ct
- 17826 Cluster Ct