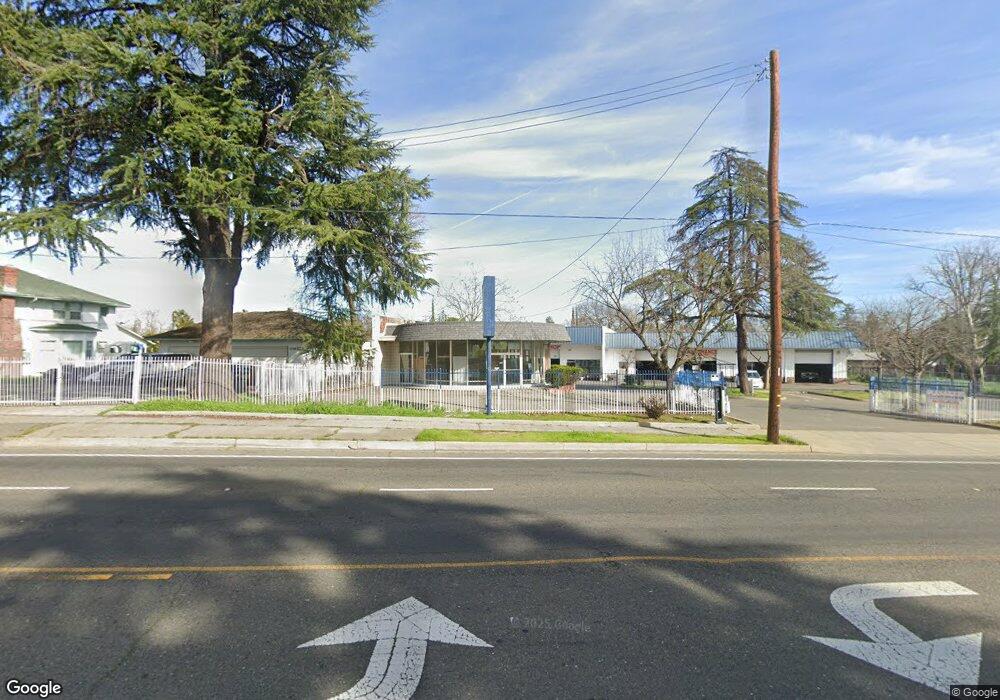
4411 Stockton Blvd Sacramento, CA 95820
Colonial Heights NeighborhoodEstimated Value: $707,042
--
Bed
--
Bath
7,041
Sq Ft
$100/Sq Ft
Est. Value
About This Home
This home is located at 4411 Stockton Blvd, Sacramento, CA 95820 and is currently estimated at $707,042, approximately $100 per square foot. 4411 Stockton Blvd is a home located in Sacramento County with nearby schools including Mark Twain Elementary School, Umoja International Academy, and Hiram W. Johnson High School.
Ownership History
Date
Name
Owned For
Owner Type
Purchase Details
Closed on
Mar 9, 2023
Sold by
Luong Vince and Luong Tina
Bought by
Vince Luong And Tina Ta Living Trust
Current Estimated Value
Purchase Details
Closed on
Feb 24, 2021
Sold by
D & T Auto Repair Partnership
Bought by
Luong Vince and Ta Tina
Purchase Details
Closed on
Feb 13, 1996
Sold by
Sacramento Commercial Bank
Bought by
D & T Auto Repair Partnership
Purchase Details
Closed on
Aug 28, 1995
Sold by
Werners Mercedes Service Inc
Bought by
Sacramento Commercial Bank
Create a Home Valuation Report for This Property
The Home Valuation Report is an in-depth analysis detailing your home's value as well as a comparison with similar homes in the area
Home Values in the Area
Average Home Value in this Area
Purchase History
| Date | Buyer | Sale Price | Title Company |
|---|---|---|---|
| Vince Luong And Tina Ta Living Trust | -- | -- | |
| Luong Vince | $600,000 | Placer Title Company | |
| D & T Auto Repair Partnership | $290,000 | Fidelity National Title Ins | |
| Sacramento Commercial Bank | $200,100 | -- |
Source: Public Records
Tax History Compared to Growth
Tax History
| Year | Tax Paid | Tax Assessment Tax Assessment Total Assessment is a certain percentage of the fair market value that is determined by local assessors to be the total taxable value of land and additions on the property. | Land | Improvement |
|---|---|---|---|---|
| 2025 | $9,914 | $649,458 | $454,621 | $194,837 |
| 2024 | $9,914 | $636,724 | $445,707 | $191,017 |
| 2023 | $9,666 | $624,240 | $436,968 | $187,272 |
| 2022 | $9,476 | $612,000 | $428,400 | $183,600 |
| 2021 | $7,376 | $445,054 | $244,011 | $201,043 |
| 2020 | $7,398 | $440,491 | $241,509 | $198,982 |
| 2019 | $7,280 | $431,855 | $236,774 | $195,081 |
| 2018 | $7,091 | $423,388 | $232,132 | $191,256 |
| 2017 | $6,970 | $415,087 | $227,581 | $187,506 |
| 2016 | $6,842 | $406,949 | $223,119 | $183,830 |
| 2015 | $6,720 | $400,837 | $219,768 | $181,069 |
| 2014 | $6,564 | $392,987 | $215,464 | $177,523 |
Source: Public Records
Map
Nearby Homes