4415 Manor Brook Dr NW Rochester, MN 55901
The Manor NeighborhoodEstimated Value: $348,019 - $375,000
4
Beds
2
Baths
2,052
Sq Ft
$177/Sq Ft
Est. Value
About This Home
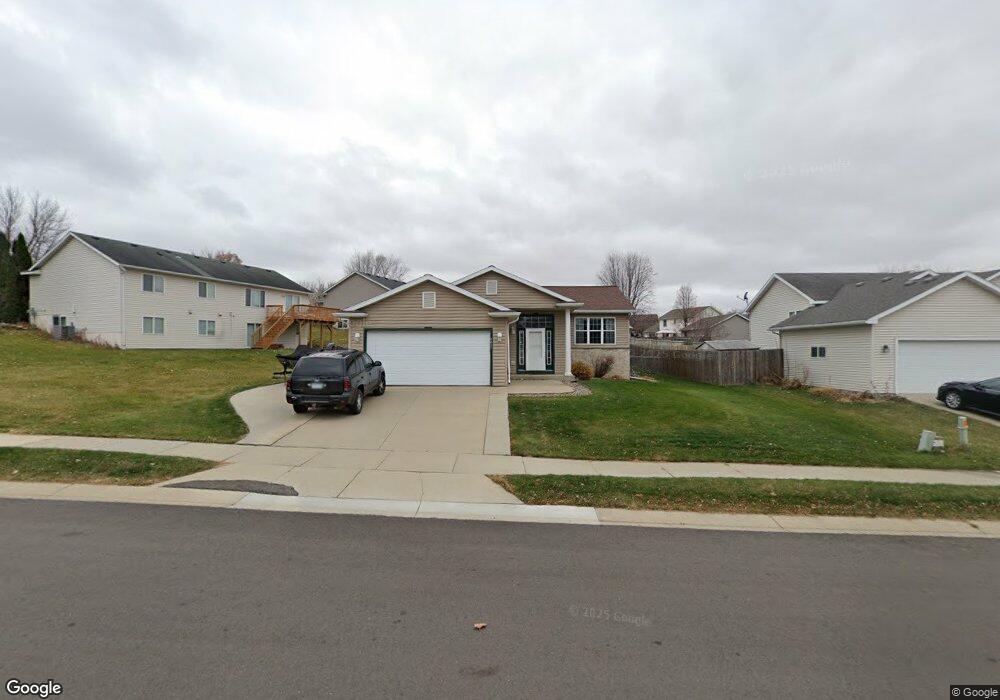
This home is located at 4415 Manor Brook Dr NW, Rochester, MN 55901 and is currently estimated at $362,255, approximately $176 per square foot. 4415 Manor Brook Dr NW is a home located in Olmsted County with nearby schools including Bishop Elementary School, John Adams Middle School, and John Marshall Senior High School.
Ownership History
Date
Name
Owned For
Owner Type
Purchase Details
Closed on
Mar 31, 2017
Sold by
Hill Peter D and Hill Jill N
Bought by
Weisend Richard T and Weisend Carla
Current Estimated Value
Home Financials for this Owner
Home Financials are based on the most recent Mortgage that was taken out on this home.
Original Mortgage
$218,500
Outstanding Balance
$181,575
Interest Rate
4.16%
Mortgage Type
New Conventional
Estimated Equity
$180,680
Purchase Details
Closed on
Jan 22, 2015
Sold by
Hill Jill N and Hill Peter D
Bought by
Hill Jill N and Hill Peter D
Purchase Details
Closed on
Oct 17, 2007
Sold by
Lepei Brian R and Lepel Kristina
Home Financials for this Owner
Home Financials are based on the most recent Mortgage that was taken out on this home.
Original Mortgage
$155,250
Interest Rate
6.38%
Mortgage Type
New Conventional
Create a Home Valuation Report for This Property
The Home Valuation Report is an in-depth analysis detailing your home's value as well as a comparison with similar homes in the area
Home Values in the Area
Average Home Value in this Area
Purchase History
| Date | Buyer | Sale Price | Title Company |
|---|---|---|---|
| Weisend Richard T | $230,000 | Rochester Title & Escrow Co | |
| Hill Jill N | -- | None Available | |
| -- | $172,500 | Rochester Title & Escrow Co |
Source: Public Records
Mortgage History
| Date | Status | Borrower | Loan Amount |
|---|---|---|---|
| Open | Weisend Richard T | $218,500 | |
| Previous Owner | Vandenameele Jill N | $155,250 |
Source: Public Records
Tax History Compared to Growth
Tax History
| Year | Tax Paid | Tax Assessment Tax Assessment Total Assessment is a certain percentage of the fair market value that is determined by local assessors to be the total taxable value of land and additions on the property. | Land | Improvement |
|---|---|---|---|---|
| 2024 | $4,008 | $302,300 | $50,000 | $252,300 |
| 2023 | $3,424 | $282,100 | $50,000 | $232,100 |
| 2022 | $3,120 | $266,800 | $50,000 | $216,800 |
| 2021 | $2,844 | $240,300 | $40,000 | $200,300 |
| 2020 | $2,914 | $221,200 | $40,000 | $181,200 |
| 2019 | $2,710 | $218,000 | $40,000 | $178,000 |
| 2018 | $2,387 | $205,500 | $40,000 | $165,500 |
| 2017 | $2,292 | $189,600 | $30,000 | $159,600 |
| 2016 | $2,162 | $153,600 | $26,300 | $127,300 |
| 2015 | $2,044 | $141,700 | $25,900 | $115,800 |
| 2014 | $1,962 | $143,300 | $26,000 | $117,300 |
| 2012 | -- | $162,700 | $30,000 | $132,700 |
Source: Public Records
Map
Nearby Homes
- 4339 Manor Park Dr NW
- 4444 3rd St NW
- 4822 3rd St NW
- 4992 4th St NW
- 4036 3rd St NW
- 828 Diamond Ridge Ln NW
- 3938 7th St NW
- 4119 Manor View Dr NW
- 3740 8th St NW
- 3586 6th St NW
- 650 36th Ave NW
- 660 36th Ave NW
- 3555 6th St NW
- 4541 Ruby Ln NW
- 468 Panorama Cir NW
- 3415 Lake St NW
- 700 Panorama Cir NW
- 4700 Country Club Rd SW
- 3304 Lake St NW
- 5470 Saint Mary Dr NW
- 4409 Manor Brook Dr NW
- 4429 Manor Brook Dr NW
- 4525 Manor Brook Dr NW
- 4432 Manorwoods Place NW
- 4403 Manor Brook Dr NW
- 4533 Manor Brook Dr NW
- 4412 Manor Brook Dr NW
- 4414 4414 Manor Woods-Place-nw
- 4414 Manorwoods Place NW
- 4506 Manorwoods Place NW
- 4418 Manor Brook Dr NW
- 4541 Manor Brook Dr NW
- 4424 Manor Brook Dr NW
- 4514 Manor Brook Dr NW
- 4408 4408 Manor Woods-Place-nw
- 4520 Manor Brook Dr NW
- 4430 Manor Brook Dr NW
- 4508 Manor Brook Dr NW
- 4520 Manorwoods Place NW
- 4421 4421 Manor Woods Place NW