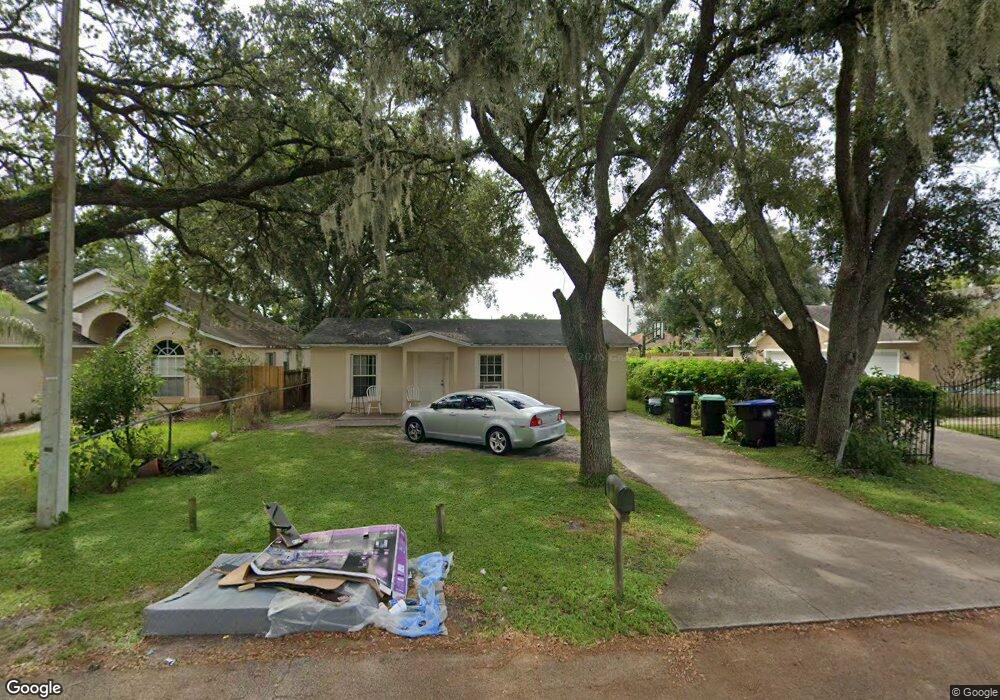
4428 Huppel Ave Orlando, FL 32811
Malibu Groves NeighborhoodEstimated Value: $175,370 - $215,000
2
Beds
1
Bath
837
Sq Ft
$237/Sq Ft
Est. Value
About This Home
This home is located at 4428 Huppel Ave, Orlando, FL 32811 and is currently estimated at $198,343, approximately $236 per square foot. 4428 Huppel Ave is a home located in Orange County with nearby schools including Ivey Lane Elementary School, Carver Middle School, and Jones High School.
Ownership History
Date
Name
Owned For
Owner Type
Purchase Details
Closed on
Oct 30, 2002
Sold by
Myles Properties Llc
Bought by
Moore Donald and Moore Elainna L
Current Estimated Value
Home Financials for this Owner
Home Financials are based on the most recent Mortgage that was taken out on this home.
Original Mortgage
$23,376
Outstanding Balance
$9,784
Interest Rate
6.01%
Mortgage Type
New Conventional
Estimated Equity
$188,559
Purchase Details
Closed on
May 15, 2002
Sold by
Roderick Ung Coc I
Bought by
Myles Properties Llc
Purchase Details
Closed on
Apr 8, 2002
Sold by
Lelia Bryant I
Bought by
Vickson O M
Purchase Details
Closed on
Nov 25, 1997
Sold by
Bryant Lelia
Bought by
Young Roderick
Home Financials for this Owner
Home Financials are based on the most recent Mortgage that was taken out on this home.
Original Mortgage
$32,000
Interest Rate
7.27%
Mortgage Type
Balloon
Create a Home Valuation Report for This Property
The Home Valuation Report is an in-depth analysis detailing your home's value as well as a comparison with similar homes in the area
Home Values in the Area
Average Home Value in this Area
Purchase History
| Date | Buyer | Sale Price | Title Company |
|---|---|---|---|
| Moore Donald | $28,000 | -- | |
| Myles Properties Llc | -- | -- | |
| Vickson O M | -- | -- | |
| Young Roderick | $32,000 | -- |
Source: Public Records
Mortgage History
| Date | Status | Borrower | Loan Amount |
|---|---|---|---|
| Open | Young Roderick | $23,376 | |
| Previous Owner | Young Roderick | $32,000 |
Source: Public Records
Tax History Compared to Growth
Tax History
| Year | Tax Paid | Tax Assessment Tax Assessment Total Assessment is a certain percentage of the fair market value that is determined by local assessors to be the total taxable value of land and additions on the property. | Land | Improvement |
|---|---|---|---|---|
| 2025 | $1,441 | $53,716 | -- | -- |
| 2024 | $1,312 | $48,833 | -- | -- |
| 2023 | $1,312 | $102,083 | $40,500 | $61,583 |
| 2022 | $1,184 | $91,323 | $38,000 | $53,323 |
| 2021 | $882 | $48,654 | $24,000 | $24,654 |
| 2020 | $824 | $49,165 | $22,000 | $27,165 |
| 2019 | $898 | $58,484 | $36,200 | $22,284 |
| 2018 | $689 | $31,530 | $10,000 | $21,530 |
| 2017 | $614 | $24,815 | $3,000 | $21,815 |
| 2016 | $585 | $24,963 | $3,000 | $21,963 |
| 2015 | $560 | $22,672 | $4,000 | $18,672 |
| 2014 | $568 | $20,655 | $4,200 | $16,455 |
Source: Public Records
Map
Nearby Homes
- 664 S Ivey Ln
- 4546 Malibu St
- 4555 Malibu St
- 442 Fanfair Ave
- 770 S Ivey Ln
- 4621 College Dr
- 4640 College Dr
- 802 S Ivey Ln
- 772 Willie Mays Pkwy
- 4217 W Jackson St
- 828 Willie Mays Pkwy
- 4409 W Gore Ave
- 4420 W Gore St
- 4438 W Gore Ave
- 4644 Barley St
- 76 Judith Ln
- 4789 Pleasant Valley Ct
- 4605 Elmira Place
- 4388 Cynthia St
- 1009 S Ivey Ln
- 4422 Huppel Ave
- 4434 Huppel Ave
- 4416 Huppel Ave
- 4440 Huppel Ave
- 4435 College Dr
- 4446 Huppel Ave
- 4441 College Dr
- 4436 Malibu St
- 4448 Malibu St
- 4452 Huppel Ave
- 4411 College Dr
- 4428 Malibu St
- 4460 Malibu St
- 4420 Malibu St
- 4405 College Dr
- 4472 Malibu St
- 4453 College Dr
- 605 Campanella Ave
- 4408 Malibu St
- 534 S Ivey Ln