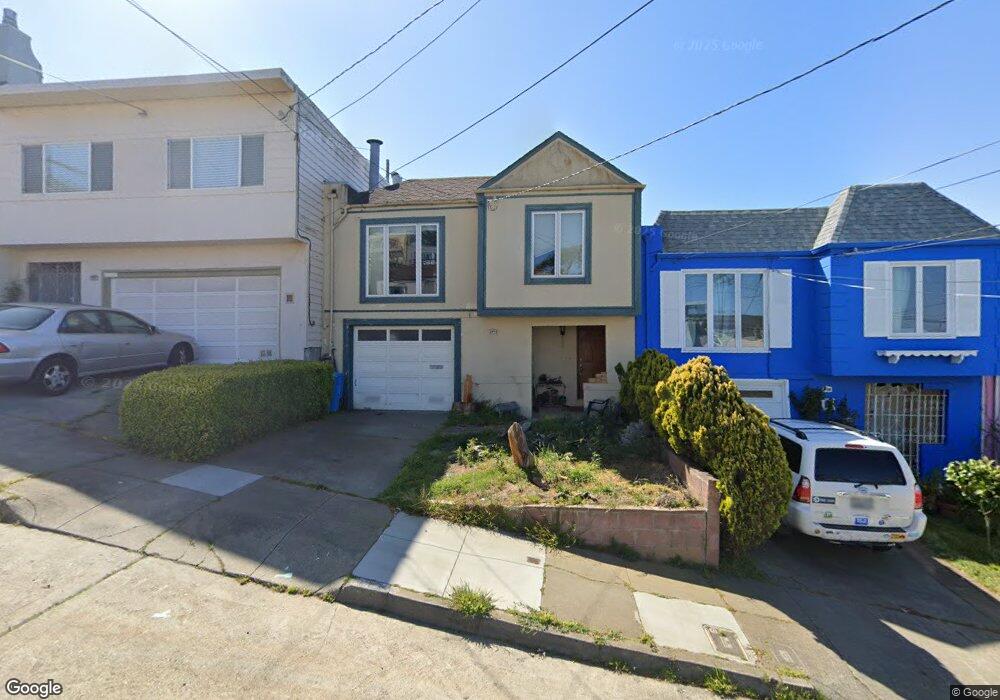
443 Bright St San Francisco, CA 94132
Merced Heights NeighborhoodEstimated Value: $1,225,000 - $1,575,000
2
Beds
2
Baths
1,975
Sq Ft
$698/Sq Ft
Est. Value
About This Home
This home is located at 443 Bright St, San Francisco, CA 94132 and is currently estimated at $1,377,784, approximately $697 per square foot. 443 Bright St is a home located in San Francisco County with nearby schools including Ortega (Jose) Elementary School, Aptos Middle School, and Leadership High School.
Ownership History
Date
Name
Owned For
Owner Type
Purchase Details
Closed on
Jun 11, 2001
Sold by
Mcgee Seamus
Bought by
Mcgee Tracy
Current Estimated Value
Purchase Details
Closed on
Jun 7, 2000
Sold by
Arren Baptiste Dorothy L 1999 Living Trus
Bought by
Mcgee Seamus
Home Financials for this Owner
Home Financials are based on the most recent Mortgage that was taken out on this home.
Original Mortgage
$245,600
Outstanding Balance
$86,151
Interest Rate
8.15%
Estimated Equity
$1,291,633
Purchase Details
Closed on
Jan 11, 1999
Sold by
Baptiste Dorothy L
Bought by
Baptiste Dorothy L
Purchase Details
Closed on
Dec 30, 1998
Sold by
Gwendolyn Baptiste
Bought by
Baptiste Dorothy L
Purchase Details
Closed on
Dec 22, 1998
Sold by
Shirley Hasty
Bought by
Baptiste Dorothy L
Purchase Details
Closed on
Dec 21, 1998
Sold by
Warren Baptiste
Bought by
Baptiste Dorothy L
Create a Home Valuation Report for This Property
The Home Valuation Report is an in-depth analysis detailing your home's value as well as a comparison with similar homes in the area
Home Values in the Area
Average Home Value in this Area
Purchase History
| Date | Buyer | Sale Price | Title Company |
|---|---|---|---|
| Mcgee Tracy | -- | -- | |
| Mcgee Seamus | $307,000 | Fidelity National Title Co | |
| Baptiste Dorothy L | -- | -- | |
| Baptiste Dorothy L | -- | -- | |
| Baptiste Dorothy L | -- | -- | |
| Baptiste Dorothy L | -- | -- |
Source: Public Records
Mortgage History
| Date | Status | Borrower | Loan Amount |
|---|---|---|---|
| Open | Mcgee Seamus | $245,600 |
Source: Public Records
Tax History Compared to Growth
Tax History
| Year | Tax Paid | Tax Assessment Tax Assessment Total Assessment is a certain percentage of the fair market value that is determined by local assessors to be the total taxable value of land and additions on the property. | Land | Improvement |
|---|---|---|---|---|
| 2025 | $9,071 | $721,125 | $283,098 | $438,027 |
| 2024 | $9,071 | $706,987 | $277,548 | $429,439 |
| 2023 | $8,929 | $693,125 | $272,106 | $421,019 |
| 2022 | $8,749 | $679,536 | $266,771 | $412,765 |
| 2021 | $8,592 | $666,213 | $261,541 | $404,672 |
| 2020 | $8,693 | $659,384 | $258,860 | $400,524 |
| 2019 | $8,349 | $646,457 | $253,785 | $392,672 |
| 2018 | $8,069 | $633,782 | $248,809 | $384,973 |
| 2017 | $7,676 | $621,356 | $243,931 | $377,425 |
| 2016 | $7,535 | $609,175 | $239,149 | $370,026 |
| 2015 | $7,441 | $600,026 | $235,557 | $364,469 |
| 2014 | $7,246 | $588,273 | $230,943 | $357,330 |
Source: Public Records
Map
Nearby Homes